
Premium growth does not always translate into higher profitability. When policy, claims, and financial data are fragmented across different systems, insurers struggle to assess the true state of their portfolios.
Cobit Solutions’ Data, AI & BI Solutions Advisor explains why individual metrics can obscure the full picture and how a unified analytics system helps reveal it.
say poor data quality is the top barrier to sound decisions
Risk.net / SAS, 2025
struggle to get a complete view of their portfolio
Federato, 2025
time goes to submissions that never become bound policies
Federato, 2025
combined ratio for insurers with advanced analytics vs. peers
WTW, 2026
As premium income increases, the financial burden associated with insurance policies can also grow. Claims payments, reserve requirements, and policy administration costs may rise at the same time, sometimes faster than revenue, putting pressure on the insurer’s profit margins.
The higher the share of high-risk policies, the higher the expected claims costs.
Rising repair and healthcare costs increase claim payouts even when claim frequency remains unchanged.
Rates that are too low may not cover the insurer's claims payments and policy administration costs.
Customer acquisition, intermediary commissions, policy administration, and claims handling can become increasingly costly.
If expected claims payouts increase, insurers must strengthen their reserves, which can reduce profits for the current reporting period.
According to the UK’s Financial Conduct Authority (FCA), the travel insurance market recorded the following changes in 2025:
increase in total insurance premiums
increase in total claims payments
claims payments as a share of premiums, compared with 31–37% in 2024
These statistics reflect the overall market and show how actual claims payments have changed relative to insurance premiums. To assess an individual insurer’s profitability, earned premiums, claims, operating expenses, and reinsurance results must be compared across the relevant periods.
Source: FCA, General Insurance Value Measures Data 2025 (2026)
Information on insurance premiums, claims, and expenses is typically spread across multiple systems within an insurance company.Â
Premiums must be linked to their corresponding policies, while claims payments and reserves must be linked to the associated insurance cases. This requires aligning record identifiers across different systems.
A single policy may have multiple versions, and one claim may involve several payments. Maintaining a history of changes and correctly linking transactions is essential to prevent missing records and double counting.
Information is updated at different frequencies, requiring scheduled automated data loads and alerts for failures or delays.
The Cobit Solutions team handles this integration through APIs and ETL/ELT processes. We configure data flows and relationships between records so insurers can analyze premiums, claims, and expenses without manually consolidating information from multiple systems.
During underwriting, insurers assess the risks associated with individual policies. However, different insured properties may be exposed to the same threat. For example, a flood or major wildfire can damage dozens of insured properties at once. When location data, sums insured, and coverage terms are stored in separate systems, insurers may underestimate the scale of potential losses.
In an April 2026 article, McKinsey described an insurer that discovered more than 25% of its commercial property portfolio was concentrated in areas with a high risk of flooding.
of the commercial property portfolio was concentrated in high flood-risk areas
by which modeled losses from a major flood could exceed reinsurance limits
Manufacturers and retail chains with multiple locations in high-risk areas
Based on the analysis, the insurer revised its premium rates and underwriting criteria and purchased additional reinsurance coverage.
Source: McKinsey, Midmarket Insurance: Managing Growth in a Complex Environment, 2026
Floods, industrial accidents, and cyberattacks can affect multiple insurance policies at once. Assessing exposure to a shared threat requires data on insured assets, coverage amounts, and risk factors, including information from external sources.
Matching insured property addresses with hazard maps reveals areas with high concentrations of insurance exposure.
Insured values, coverage limits, and policy terms are used to model potential damage and estimate claims payouts under different scenarios.
Comparing potential losses with reinsurance limits and the insurer's retention shows how much of those losses the insurer would need to cover.
We prepare and validate your insurance data for risk analysis with our data cleansing services. This includes verifying addresses, eliminating duplicates, linking insured assets to policies, and connecting external sources of risk data. As a result, you gain a reliable foundation for assessing risk concentrations and planning reinsurance coverage.
During the settlement process, insurers may incur avoidable financial losses.
Staged car accidents, inflated claims, and duplicate submissions. Cross-referencing policyholder data, claims participants, and previous payouts helps identify suspicious patterns.
Inflated repair shop invoices, duplicate payments, and overlooked deductibles or coverage limits. Analyzing repair estimates, policy terms, and actual payouts helps detect unjustified amounts.
Lengthy repair approvals can increase rental car expenses, while missed deadlines may lead to legal costs and penalties. Analytics reveals where delays occur throughout the claims process.
Incomplete documentation or missed legal deadlines can prevent insurers from recovering payments from liable third parties. Linking claim files, payment records, and legal documents helps track and manage these recoveries.
A large pan-Asian insurer integrated claims data from three legacy systems with external sources to improve claims analysis.
claims processed annually
saved within the first few months
of flagged cases otherwise missed
The analytics models detected duplicate claims, inflated invoices, unjustified expenses, and suspicious connections between service providers. According to the insurer, the 80% figure refers to detected cases showing signs of fraud that would have gone unnoticed without the system.
Source: Shift Technology — Real-Time Detection of Fraud, Waste and Abuse by a Pan-Asian Insurer
To detect overpayments, delays, and missed recovery opportunities, insurers need a complete history of every claim.Â
Matching claims, decisions, and payments helps identify duplicates, unusual amounts, and other transactions that require investigation.
Claims history reveals where delays occur and how they affect costs.
Data on responsible parties, subrogation, and recourse claims helps track opportunities to recover losses from third parties.
Cobit Solutions specialists can build a centralized data warehouse that brings claims, policies, payment records, and settlement decisions into a single system. We configure automated updates, establish relationships between records, and preserve transaction histories. This gives you reliable data to detect duplicate payments, investigate processing delays, identify recovery opportunities, and control claims handling costs.
The ultimate cost of settling many insurance claims becomes clear only months or years later. During that time, initial estimates may change, affecting the insurer’s financial performance.
Medical services, replacement parts, and repairs become more expensive, driving up claim costs. If prices rise faster than expected, initial reserves may prove insufficient.
In liability insurance, litigation and determining compensation amounts can take years. During this period, case circumstances and expected payouts may change.
Insured events have already occurred, but the insurer has not yet received claim notifications. Their costs are estimated using historical data, so changes in reporting delays can alter the accuracy of these estimates.
Courts may begin awarding higher compensation in similar cases. This can require insurers to revise expected payouts for claims from previous years.
According to the Swiss Re Institute, US insurers added $16 billion to liability reserves in 2024 after previous estimates of claims losses proved insufficient.
to liability reserves in 2024
in the calendar-year loss ratio for liability lines
the source of underestimated liabilities
These adjustments brought costs associated with earlier claims into the 2024 financial results, weighing on liability-line profitability. Favorable reserve development in other insurance lines helped offset the impact.
Source: Swiss Re Institute — US Property & Casualty Outlook: The Past Weighs on the Present, 2025
To assess reserve adequacy, insurers need to compare previous loss estimates with actual claims payments.
Standardized rules for calculating losses, claims payments, and reserves across all analytical reports.
Tracking initial estimates and subsequent adjustments for each claim.
Analyzing claims payments and reserves by the periods in which claims occurred and were settled.
Comparing previous estimates with actual claims payments and current reserves.
Through business analytics consulting services, Cobit Solutions specialists can develop such a model and automate metric updates. As a result, actuaries gain reliable data to assess reserve adequacy and refine their forecasts.
Even within the same insurance product, profitability can vary across customer segments and sales channels. Some policies generate steady premium income over several years, while others involve substantial acquisition and servicing costs. To identify promising growth opportunities, insurers need to understand the full economics of each customer relationship.Â
Comparing policy histories, premiums, claims, and acquisition costs helps assess customer profitability over the entire relationship. Renewal rates and purchases of additional insurance products provide further insights.
Comparing earned premiums, incurred losses, and related expenses reveals the financial performance of each product line. Breaking down results by risk group helps identify segments with potential for portfolio expansion.
Agent networks, brokers, and direct sales differ in commissions, customer acquisition costs, renewal rates, and risk profiles. Analyzing these metrics helps identify which channels deliver sustainable profitability.
In 2026, WTW published a study examining how advanced analytics and AI adoption relate to insurers’ financial performance. The findings showed that companies with more mature analytics capabilities achieved stronger results than those adopting these technologies more slowly.
indicating a smaller share of premiums spent on claims and operating expenses
higher premium growth compared with slower
adopters
companies from the United States and Canada included in the study
The study covered financial results from 2022 to 2024. These findings can serve as a benchmark for insurance companies seeking to understand how investments in analytics and AI affect financial performance.
Source: WTW, Insurers Using Advanced Analytics and AI Report Strong Returns on Investment and Premium Growth, 2026.
Power BI dashboards help identify the most profitable areas of an insurance business and uncover opportunities for growth.
To achieve this, data on insurance premiums, claims payments, commissions, and other expenses is brought together in a unified analytics system. Executives can compare financial performance across different periods, track changes in profitability, and investigate the reasons behind fluctuations.
With these insights, insurers can make informed pricing decisions, plan expansion into promising business areas, and allocate resources where they can deliver the greatest value.
Cobit Solutions can develop interactive Power BI dashboards with consistent metrics and detailed data breakdowns. We configure reports so insurance executives can compare performance, identify unprofitable business areas, and make informed decisions.
Comparing premiums, claims, and expenses reveals which customer groups generate the highest profits.
Analyzing loss ratios and profitability helps identify products that may require premium rate adjustments.
Comparing premiums, commissions, and claims payments reveals the financial performance of agents, partners, and direct sales channels.
Comparing metrics over time helps identify negative trends and understand their causes.
Each department within an insurance company tracks its performance metrics. The sales department tracks premiums and new policies, underwriters assess risks, the claims department monitors losses, and the finance team tracks expenses and reserves. However, even accurate departmental reports may fail to provide a complete picture of overall financial performance.
Departments may calculate premiums, loss ratios, and profitability differently, leading to conflicting reporting results.
Sales metrics don't account for all claims payments, reserves, and expenses associated with insurance policies.
Manually consolidating information from multiple systems makes it difficult to analyze changes promptly.
Departments evaluate their performance without always seeing the impact on the entire insurance portfolio.
In a 2025 study sponsored by SAS, Risk.net surveyed 350 senior insurance leaders worldwide. The research revealed persistent challenges with data quality, collaboration, and access to reliable information:
consider poor data quality a barrier to effective decision-making
said poor collaboration between departments makes data analysis more difficult
are unsure whether they have complete, up-to-date data on risks, revenue, and expenses
These findings reveal how fragmented information and disconnected teams can undermine business decisions. Reliable data, consistent metric definitions, and better coordination across departments are essential for comprehensive insurance analytics.
Source: SAS, Insurers’ Decisions Often Made in Silos, 2025
Comprehensive analytics requires an end-to-end data process, from collection to visualization. When insurance data is scattered across separate systems, departments may use different figures to assess the same results. A unified framework ensures consistent information across the business, making it easier to evaluate performance and support informed decisions.
The Cobit Solutions team can deliver a comprehensive insurance analytics solution through our BI implementation services. We integrate data sources, configure data processing, and develop analytics tools tailored to the insurer's business needs. As a result, executives gain consistent metrics for analyzing risks, expenses, and financial performance.
Connecting policy systems, CRM, financial and payment systems, claims management platforms, and external data sources.
Removing duplicates, validating records, and aligning identifiers across systems.
Storing connected data and maintaining a complete history of insurance transactions.
Establishing consistent rules for calculating premiums, losses, reserves, and profitability.
Automating report updates and building interactive dashboards for different departments.
Applying predictive models to prepared insurance data to forecast claims, identify suspicious activity, and support risk assessment.
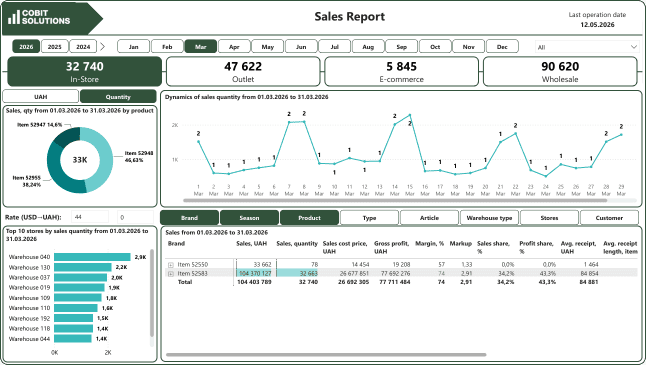
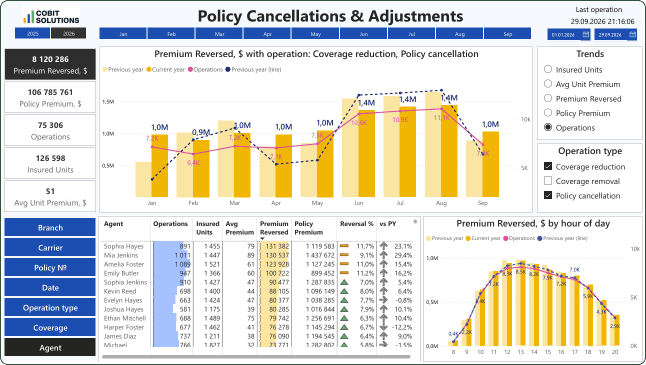
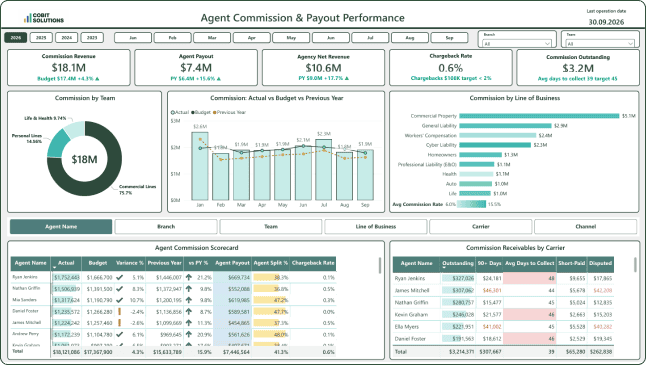
Once data has gone through every preparation stage, insurers can analyze their business from multiple perspectives. They can drill down from high-level metrics to policy sales, premium refunds, customer retention, or agent performance. Cobit Solutions develops interactive Power BI dashboards for this type of analysis. Below are three examples of our solutions.
Our track record is backed by completed projects, client reviews, and independent industry rankings. We know how to work with complex data, develop solutions tailored to specific business needs, and provide ongoing support after implementation.
Start in 1 week, work on EST hours, get results fast
25+ Data, BI & Finance experts ready to help
8+Â years delivering data solutions in 22+Â industries
Trusted by 70+ clients across 5Â countries
Save 40% vs. building the same team in-house
Full end-to-end delivery, from DWH to support & AI

Planning to implement insurance analytics? Discuss your company's needs with our specialists and get recommendations on where to start.
Explore real Cobit Solutions projects to discover the business problems our clients faced, how we approached them, and the measurable results achieved.
Healthcare
Result:
Logistics
Result:
Manufacturing
Result:
Industry-focused case studies designed for your needs

Absolutely! The Cobit Solutions team works with machine learning, predictive models, and AI-powered analytics. We can tailor these technologies to the specific needs of insurance companies, including:
We select solutions based on your business needs and the quality of your existing data. Learn more about our AI analytics and machine learning capabilities.
Schedule a complimentary consultation with Cobit Solutions. We’ll discuss your company’s goals, review your existing systems, and recommend an implementation plan tailored to your budget and priorities.
It depends on your company’s goals. Profitability analysis requires data on policies, premiums, claims, payouts, reserves, and operating expenses. Customer and sales channel analysis also draws on CRM data, while risk assessment may require information about insured assets and external threats.
You don’t need to connect every data source at once. We’ll help you identify priorities and expand your analytics capabilities step by step.
We understand how important it is for insurance companies to protect their customers’ personal and financial information. That’s why we agree on security requirements before the project begins, sign a nondisclosure agreement (NDA) when needed, and work only with authorized data. We can also carry out the project directly within your company’s infrastructure, so you maintain control over your information.
You can get the first working version of a dashboard in as little as 2 weeks, then refine it to fit your company’s needs. Analytics projects involving data integration typically take 3–6 weeks, while larger projects that include building a data warehouse may take several months. Once we’ve reviewed your existing systems, we’ll provide a more precise timeline.
fill in the form to get the whitepaper