Data Visualization Services For Smarter Business Decisions






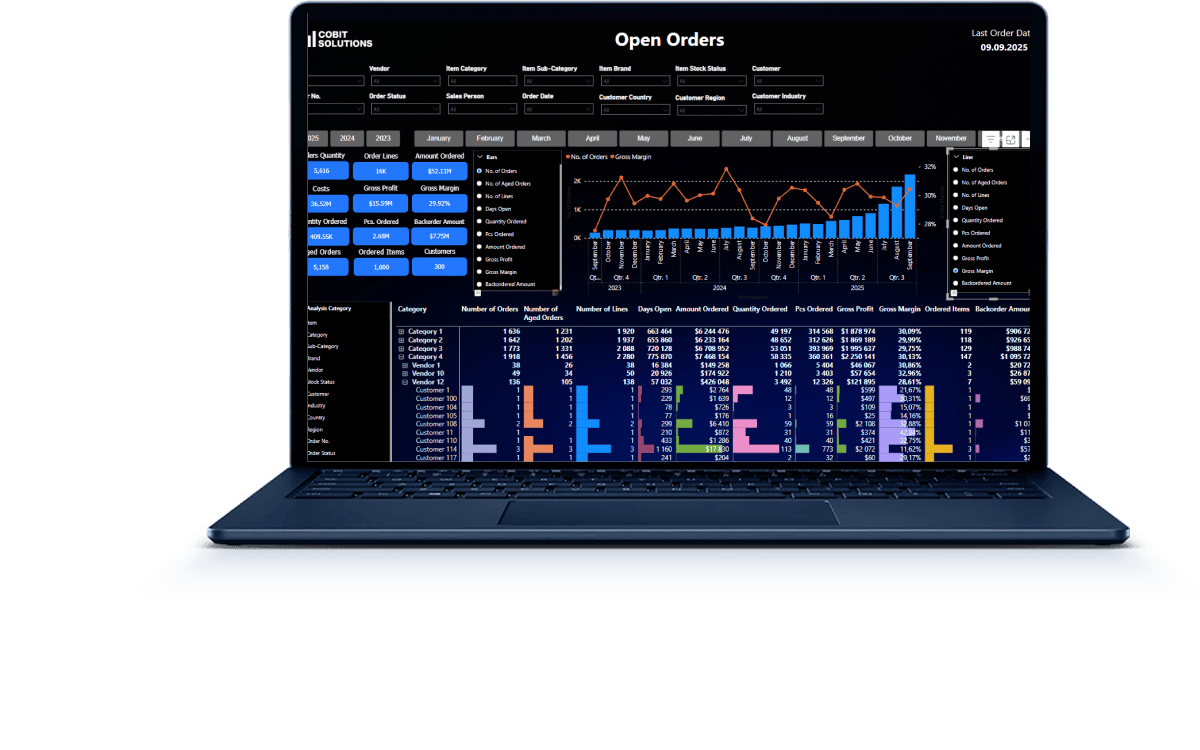

Identify deviations in plans and financial risks before they become a problem.

Make decisions based on current metrics, not intuition.

Reduce the time spent analyzing and reconciling data between teams.

for business intelligence successful implementation


Microsoft Power BI Solutions
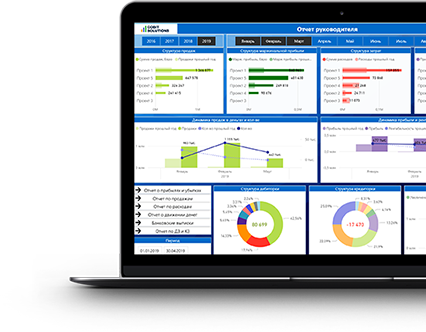
A tool for creating interactive dashboards and reports that integrates with most enterprise systems. Power BI allows you to combine information from different sources and quickly identify key business trends.

Tableau Visualization Services
Tableau is suitable for working with large amounts of information. Flexible tools for creating graphs and charts help present data in the most understandable way.

Looker / Google Data Studio Solutions
Looker and Data Studio enable teams to collaborate effectively based on metrics. With these tools, you can not only build dynamic reports, but also integrate with Google services for end-to-end analytics

Qlik Sense Visualization Services
Qlik Sense provides a flexible approach to self-service analytics. Its associative model allows users to quickly find connections between metrics and work with data without rigid queries—that is, without preprogramming the logic of connections.
Hire a Leading Data Visualization Agency at 50 USD/h
Schedule a 30-minute online meeting to discuss your Business Dashboard, AI/ML
DWH and ETL development needs and you'll get a detailed quote in 48 hours
Or text us via Messenger



How Data Visualization Services Drive Better Comprehension

Turning Raw Data into Powerful Business Stories
Data visualization services structure this stream into a logical picture. You get an analytical model that shows which products generate profit, how many customers make repeat purchases, and which regions are lagging behind in terms of dynamics.
It is no longer a set of numbers, but a story about business behavior that can be read intuitively. And it is this picture that allows managers to make decisions quickly, reasonably, and in a timely manner.

Driving Business Decisions at the Speed of Data
You open the dashboard and immediately see the current situation: what is working, where there are shortcomings, and what actions are needed.
It's like a dashboard in a car that shows speed, engine temperature, and fuel level. System signals are always in front of your eyes so you can react without delay. The dashboard also allows you to respond to market changes accurately and quickly.

Simplifying Complexity into Clear Visuals
Instead of dozens of tables with financial metrics, managers see a single chart that scans the profitability structure by department like an X-ray.
The tool immediately shows where the system is working effectively and where it requires intervention. This simplifies access to the essence and saves you time.
Case Studies: How Clients Succeed with Our Data Visualization Services
Check out real-life cases where visualization has been a decisive factor in growth, optimization, and strategic breakthroughs.

Healthcare
“Dobrobut” clinics network
Result:
- The clinic’s directors receive a P&L report updated daily.
- Management uses a daily dashboard for budget-versus-actual analysis of operational indicators.
- Dashboards combine data from ERP and the Doktor Eleks medical system.

Logistics
Meest China
Result:
- Dashboards combine data from ERP and CRM.
- Route margins are automatically calculated in dashboards and monitored every day by management.
- A Profit & Loss report is generated daily.

Manufacturing
Steelite International USA
Result:
- Automated reporting, reducing turnaround from 10 days to overnight.
- Scaled visibility from regional to global (US, UK, Canada, Europe, Australia).
- Centralized data enabled data-driven decisions on a weekly cadence instead of monthly.
Industry-focused case studies designed for your needs


Ready to Master Your Data Visualization Strategy with Our Customized Services?

Cutting-Edge Technologies and Tools for Visualization Services
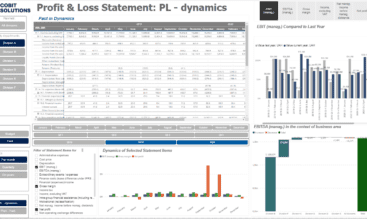
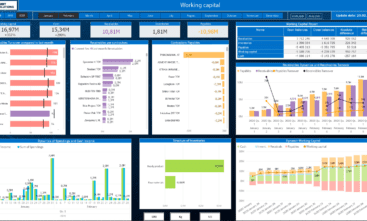
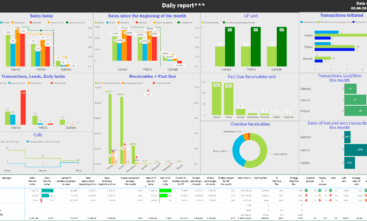
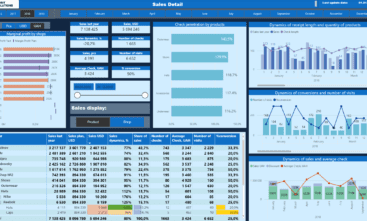
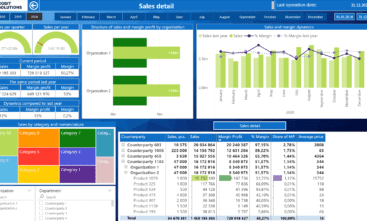
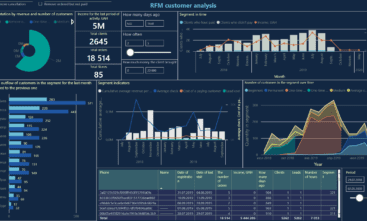
To ensure that visualization works as a management tool, we use platforms that combine flexibility, integration, and speed. Each of them allows you to see your business in motion, identify patterns, and make managed decisions based on data.





















Testimonials for Our Business Intelligence Services

Manufacturing

Steelite International USA
“Cobit Solutions quickly understood the complexity of our environment and delivered strong results across a wide range of subject areas. They adapted fast, worked effectively under tight timeframes, and consistently provided high-quality technical and business input throughout the project. We now see them as a consistent and valuable partner in our ongoing data journey.”
Josh Rammel
Global Head of IT

Distribution & Wholesale
Site Landscape Development
“Second only to the Mona Lisa, it is the most beautiful work of art I’ve ever seen in my life… For real, it’s great. It’s exactly what we needed and we’re looking for. It’s good visualizing it that way. All is very good. This stuff’s awesome.”
Andrew Craft
President at Site Landscape Development

Logistics
Self-Storage Facilities in 6 countries
“We want to express our sincere appreciation for all the support you’ve provided… From tackling urgent challenges like data upload to creating the initial flash report and making progress on complex issues; your contributions have been invaluable.”
Julia MacDonald
Group FP&A Manager

Retail
“HELEN MARLEN” fashion boutiques
«Now all my data is updated every day. I take a look from time to time, when I’m making my own report, whether the numbers coincide. Having made sure it’s alright, I just carry on with my life in peace.»
Serhii Tupkalo
Board member, CFO at HELEN MARLEN L.P.

HoReCa
“Salateira” restaurants chain
“The project helps us quickly and remotely see the information available for the company all over the world, besides it is updated daily.”
Olena Vasylevska
Chief Financial Officer of the chain of restaurants "Salateira"

IT companies
SPAN
“Certainly, the automation of business analysis will contribute to the flexibility and efficiency of making important decisions for the company while maintaining high standards of information security.”
Oleg Avilov
CEO at SPAN

IT companies
The App Solutions
“The work delivered by Cobit Solutions met all expectations and the team demonstrated their skill and expertise well. I highly recommend the services and look forward to future collaborations.”
Kateryna Ishchuk
Partnerships Director The App Solutions

Distribution & Wholesale
Frendt LLC
“Automation of business analysis helps us to see and control key metrics in real time, both of individual areas and of the entire business as a whole, which allows us to make timely and effective management decisions.”
Andrii Marchenko
Chief Information Officer of Frendt LLC

IT companies
Alpha Serve
“The developed perfectly looking BI templates allow our clients to quickly build their first report in Power BI and include the most relevant KPIs for reports.”
Anna Odrynska
Chief Strategy Officer at Alpha Serve

Healthcare
“Dobrobut” clinics chain
“Thanks to dashboards, we can also make a forecast of our financial indicators for a month, quarter or half a year and have the opportunity to compare the actual financial result with our predicted one – to understand the completeness of the reflection of expenses and income.”
Andrey Arbuzin
Deputy financial director
LEAVE A REVIEW FOR OUR Professional Data Visualization Services For Smarter Business Decisions
Implement Practical Data Analytics In Your Business Today
Implement Practical Data Analytics In Your Business Today
Or text us via Messenger