Home » Blog » Сash Flow Dashboard. Catch your visual representation

Сash Flow Dashboard. Catch your visual representation

Get professional Cash flow dashboards 📈 with Cobit Solutions’ experienced specialists who have implemented BI in dozens of industries.

To be successful in operating any business will have to manage the workflows. To see the growth or losses you need to track numerous metrics and numbers every company gets as the result of its activity. Thus, it becomes a real problem of how to manage if you don’t understand where you are now? For this purpose, businesses need analytical dashboards to track the actual state and goals achievement.

The leading tool for the businesses is Power BI dashboard with its many functions of real-time insights and process optimization to help with vital business decisions. CashFlow Power BI report will show the movement of funds by income, outcome plus reflect net cash flow and cash balances provided by branches, projects, etc.

What is a Cash flow Dashboard?

Cashflow dashboard is your visual representation of money in the accounts for the periods. Having it, any dashboard owner or decision maker can filter information, choose time periods, add real-time data and even create new dashboards. This dashboard gives a real picture of your key performance indicators (KPIs). According to the name, these are common metrics to track which show the effectiveness of work. Choosing KPIs is a real art and serious process which demands your update over time.

The metrics in Cash flow dashboard may include:

Using the vital KPIs numbers of a team’s progress the workflow can be managed toward goals and cash flow targets. Decision makers can even see issues before they grow to huge problems and manage the processes.

See more digital marketing dashboard examples to suit your needs and identify spend on and top/bottom performing products across each marketing funnel.

What does the Cash flow dashboard show and what is it for?

Cashflow dashboards provide a visual representation of your most recent performance metrics, actual amount of turnover funds, and cash balances. It audits the current situation for cash gaps identifications and suggests solutions.

What are the benefits of Power BI Cash flow dashboard:

It gives you a concise view of results-based reports which can reflect metrics by dates, in the regions, branches, by direction and so on. 


General types of analyzes are not just the fact, but the comparison of fact and last year, fact and plan, fact and last month.

Cobit Solutions Clutch Review:

Number of Reviews

16

Project Cost Range

$

10.000

to

49.000

Average Referral Rating

5/

5

What are the target roles and dashboard users?

Cashflow dashboard can be used for the key persons who need to increase financial control of companies. Its target roles and users positions in the organization are:

Demo Cash Flow Dashboard:

“A BI system helps automate the reporting: customize the algorithm for data processing and then use it continuously in the automatic update mode” – says Dmytro Chashnyk, CEO of Cobit Solutions, Expert in IT with 19 years of experience, 10 years in CIO/CTO positions.

Other types of Cash Flow dashboard:

Cash flow forecast dashboard is an important dashboard for the start of business analytics. Developing interactive dashboards and consolidating data from any IT system makes provisions for 24/7 access to the data from any device. Check it when you need the vital data for decision making to predict the following period if things go as planned, or change a number of indicators and watch the results. 

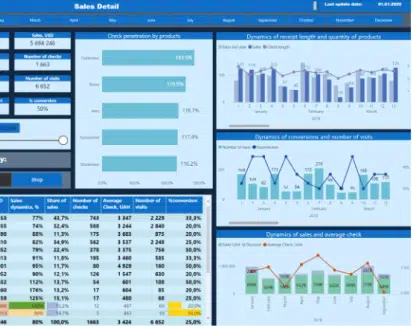
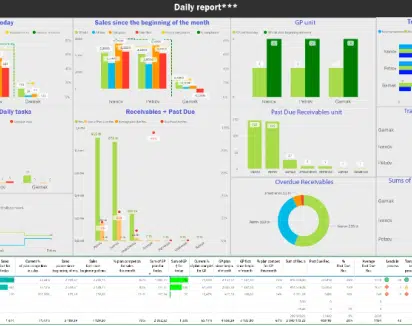
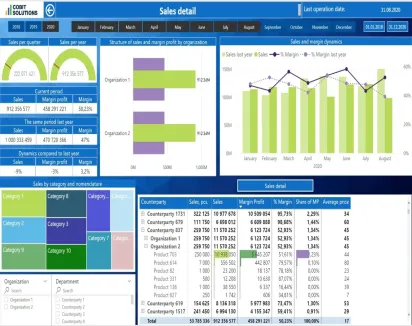
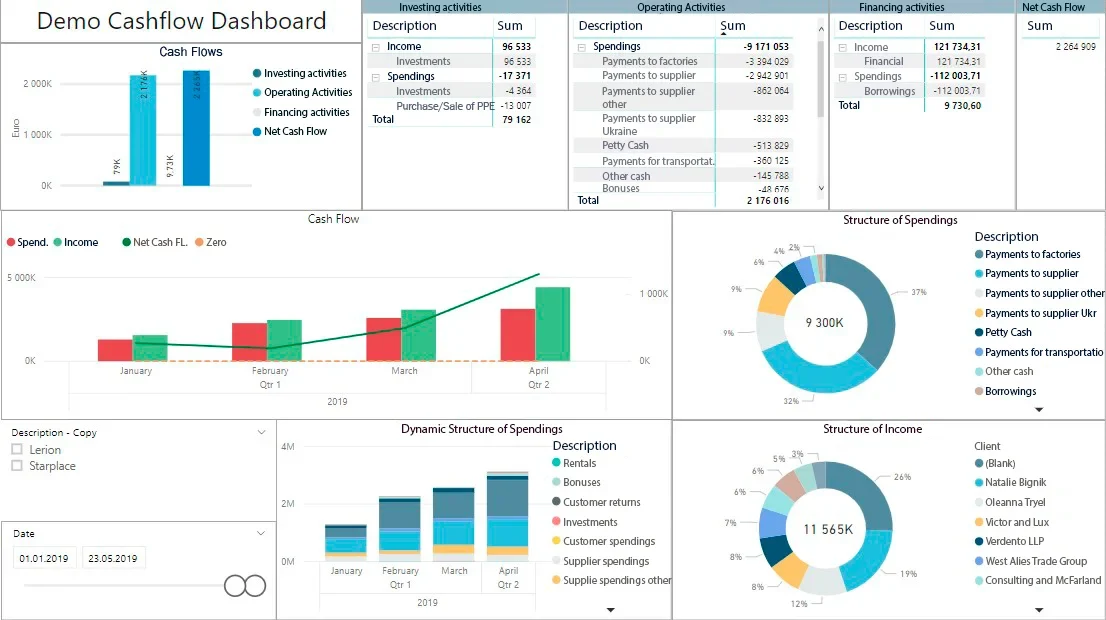
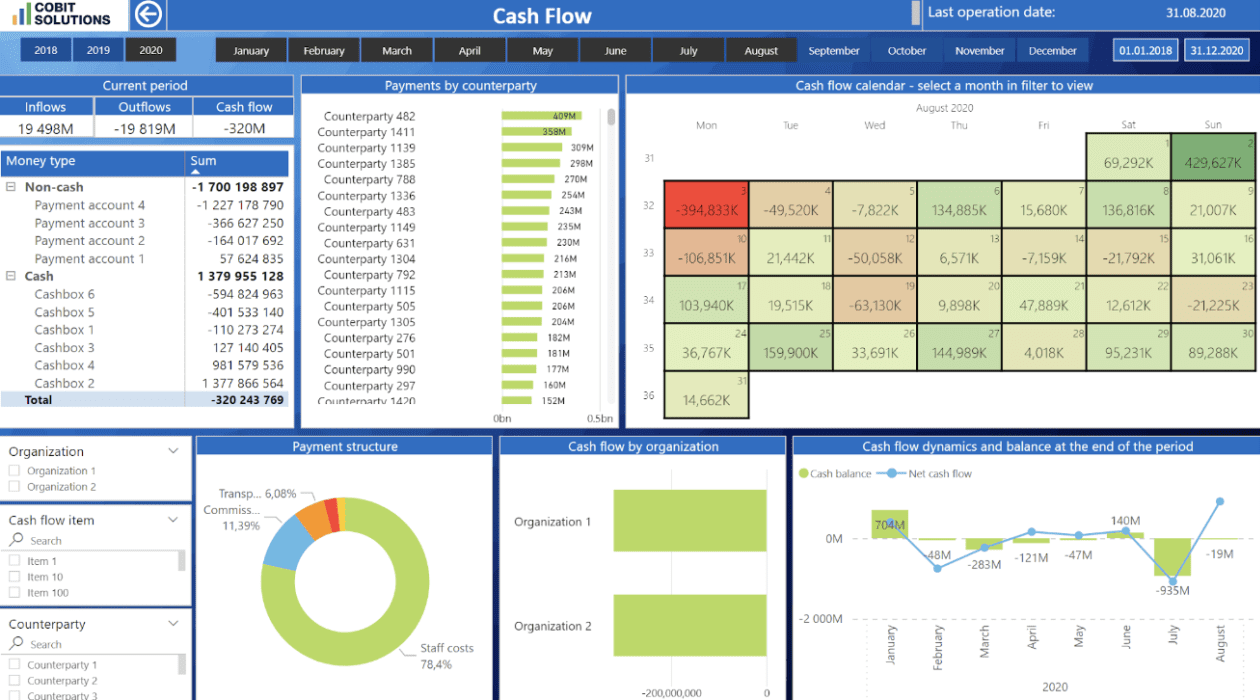
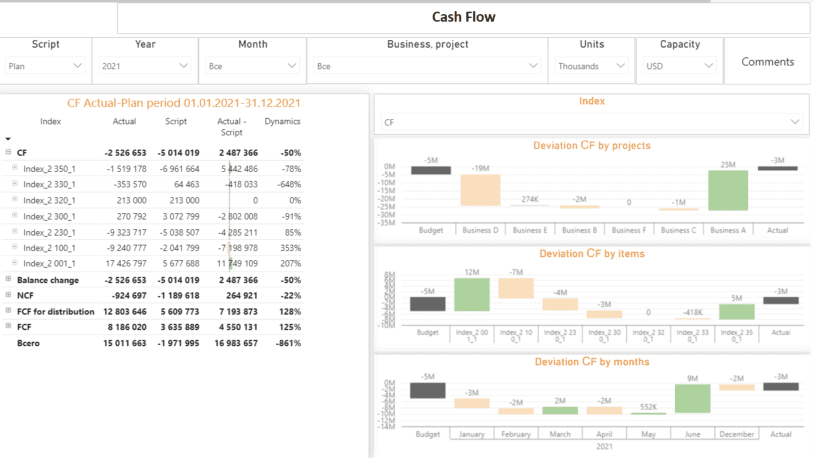
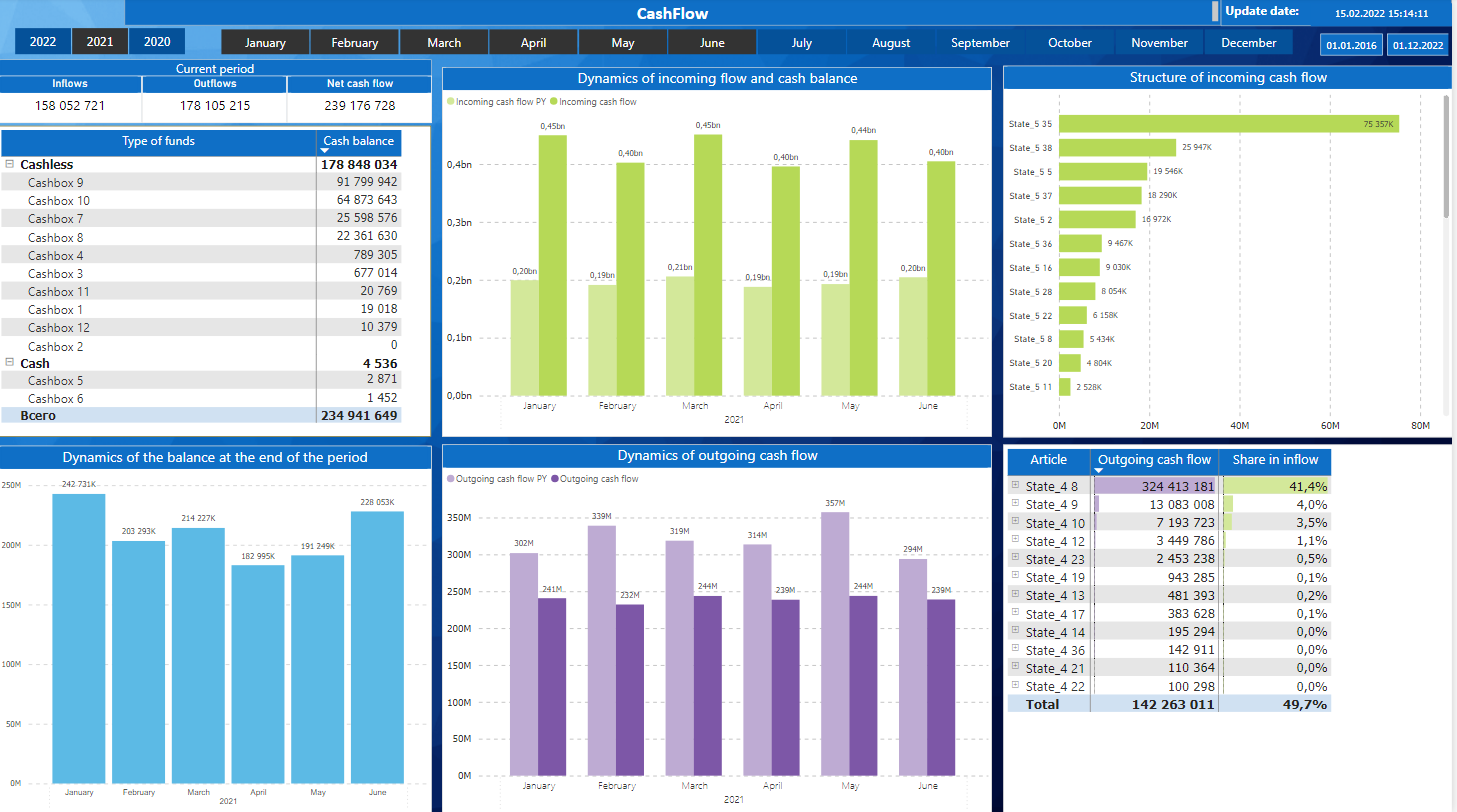
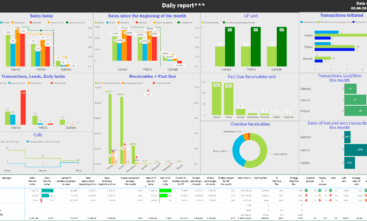
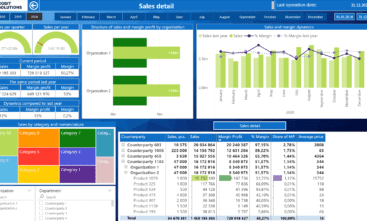
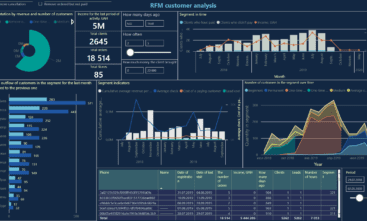
CASH FLOW DASHBOARD VARIATIONS

Our Power BI consultants will develop tailor made dashboards that will help effectively control sales

Salesforce Dashboard

Salesforce Dashboard

CRM Sales Department Daily Report

Sales Dashboard

Sales Dashboard

Margin and revenue factors analytics

Marketing dashboard

Marketing dashboard

RFM customers database segmentation analysis

OUR Power BI consultancy benefits

  • Leveraging best practices:
  • Saving your time and money
  • Power BI and data technology experts  implementing turn-key data solutions
  • Delivering customized dashboards crafted for your organization's needs
  • 20-30% less expensive than hiring a local FTE.
Cobit Solutions

Power BI, ETL, DWH Development:

[:en]stars[:]
Quality
5.0/5
Schedule
5.0/5
Cost
5.0/5
Willing to Reffer
5.0/5

Turn-key BI implementation services:

ETL Data
Integration

[:en]File_Code[:]

Get the turnkey ETL data integration services for ERP, API, CRM, DB, Excel and any other IPs

BI Dashboard
Development

[:en]Note_Search[:]

Build custom dashboards tailored to business needs, including front-end interfaces and core back-end technologies

Platform and
Infrastructure

[:en]Processor[:]

Transforming your data silos into high-end decision-making tools on the Power BI platform for daily updated reports.

AI/ML and
Data Science

[:en]Select_Multiple[:]

Implementing AI/ML and data science options into interactive analytics solutions that help organizations increase revenue and margins

What's Your Stack?

Our development services already power over 150 active engagements. We typically land our teams within 2 weeks, so you can start shipping top-quality software, fast.

GET COMPANY MANAGEMENT DASHBOARD

Cobit Solutions

More articles and cases

Business Intelligence and BI Integration Services

15 Mar 2024

Business Intelligence and BI Integration Services

Cobit Solutions is a data analytics and business intelligence company that specializes in Power BI, Azure, SSIS, SSAS, AI/ML, ETL, and DWH. ...

Read More
Marketing Dashboard. Estimate Activity and Campagins

03 Jan 2024

Marketing Dashboard. Estimate Activity and Campagins

Get professional marketing dashboards with Cobit Solutions’ experienced specialists who have implemented BI in dozens of industries. G ...

Read More
Sales Dashboard improves your business effectiveness

21 Nov 2023

Sales Dashboard improves your business effectiveness

Sales analytics dashboard provides a visual representation of your most recent performance, dynamics, structure and effectiveness of sales ...

Read More

KEY FIGURES OF THE COMPANY

457

dashboards created in 2022

150+

years of IT experience among employees

17

data experts & BI consultants

12B

USD annual revenue of clients that utilize our analytics solutions