Home » Power BI Blog

BI BLOG: SYSTEMS AND DATA ANALYTICS

HOW BUSINESS INTELLIGENCE (BI) WORKS
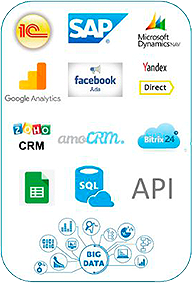
DATA IN DIFFERENT SYSTEMS
DATA IN DIFFERENT SYSTEMS

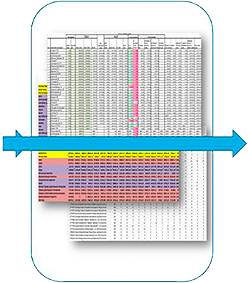
UNRELATED REPORTS
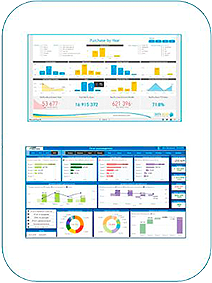
UNRELATED REPORTS

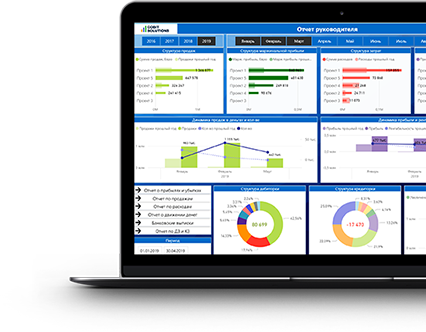
UNDERSTANDABLE DASHBOARDS IN BI

UNDERSTANDABLE DASHBOARDS IN BI

HOW BUSINESS INTELLIGENCE (BI) WORKS

Businesses collect a tonne of data, but the trick is to make sense of these complicated, dispersed numbers.

BI systems are made to produce real economic benefits as well as to gather data.

You get with Cobit Solutions:

– Better control and confidence
– Notable Increase in company value
– Priceless Time Savings
– Increased Income and Profitability

ECONOMIC EFFECTS OF BUSINESS INTELLIGENCE:

Power BI’s Interactive Features: How to Make Dashboards User-Friendly and Easy to Understand

06 May 2026

Power BI’s Interactive Features: How to Make Dashboards User-Friendly and Easy to Understand

Static reports quickly lose their value when users can’t interact with the data. This video shows you what to do to ensure your dashbo ...

Read More

How to go from the chaos of hundreds of thousands of metrics to analytics with 99% accuracy

23 Apr 2026

How to go from the chaos of hundreds of thousands of metrics to analytics with 99% accuracy

Case study of a data warehouse and BI implementation for a global manufacturing company. Learn how to integrate data from 8 ERP systems and ...

Read More
Top 12 Power BI Dashboard Reports Examples in 2026

21 Sep 2025

Top 12 Power BI Dashboard & Reports Examples in 2026

The ultimate goal of any business is making profit. And in the times of a crisis it is also minimizing the cash shortages. Let me use 12 mai ...

Read More

How Power BI Can Improve Customer Service

16 Jan 2025

How Power BI Can Improve Customer Service

Learn how Power BI transforms customer service with real-time data, predictive analytics, and customizable dashboards for better decision-ma ...

Read More
How to Prepare Your Business for a 2026 Recession Or Market Downturn

08 Jan 2025

How to Prepare Your Business for a 2026 Recession Or Market Downturn

65 Key Business Performance Indicators (KPIs) across 15 critical areas for analyzing your business’s resilience. By leveraging these KPIs, b ...

Read More
15 Power BI Success Stories

19 Nov 2024

15 Power BI Success Stories

Explore 15 real-world success stories showcasing how Power BI helps businesses across industries unlock actionable insights, enhance efficie ...

Read More

Power BI Consulting Process

1

Initial Consultation

Start with a 30-minute virtual session with a Power BI consultant. During this conversation we review your goals, discuss reporting challenges, and identify the most valuable visualization opportunities for your data.

2

Project Proposal

Our team analyzes your data sources, existing infrastructure, and reporting requirements. Within three business days we prepare a clear proposal that outlines the scope of work, recommended solution, development stages, and estimated timeline.

3
Implementation Start

After approval, development begins. We configure the environment, establish data connections, and start building analytical models and dashboards tailored to your business needs.

Power BI's Interactive Features: How to Make Dashboards User-Friendly

Static reports quickly lose their value when users can’t interact with the data. This video shows you what to do to ensure your dashboard isn’t just a visualization but becomes a practical tool for analysis.

What does a report that’s actually used in real-world work look like? Ideally, it’s an interface where you can ask questions of the data and get answers right away. This video breaks down the key interactive features of Power BI that help you build exactly these kinds of dashboards—with logic, navigation, and a clear user experience.

Let’s see how to use standard Power BI tools to make a report manageable and convenient. A dashboard consists of separate pages that are responsible for different aspects of the analysis. This allows you to quickly navigate the data and move from the big picture to the details without overloading the interface.

The presented dashboard consists of 7 pages

The transition between pages is implemented through an interactive menu. Each menu item activates a corresponding viewing scenario, which allows you to quickly switch between analysis blocks. Additionally, filters and other tools are used to help tailor the report to a specific user question:

Interactivity in Power BI isn’t about “flashy effects.” It’s about control over data, faster decision-making, and convenience for those who work with reports every day. If a dashboard doesn’t help you ask questions and find answers, it isn’t doing its job. Watch the video to see how these tools work in practice, and use them in your reports.

every executive knows:

ANALYSIS OF INDICATORS INCREASES PROFITS

Real Time Manufacturing Analytics: Insights & Solutions

14 Sep 2024

Real Time Manufacturing Analytics: Insights & Solutions

Learn how Power BI manages real-time data with dynamic dashboards and actionable insights ...

Read More
Tableau vs Power BI: Which One Is Better?

31 May 2024

Tableau vs Power BI: Which One Is Better?

Compare Tableau and Power BI to find the best analytics tool for your business needs ...

Read More
Business Intelligence for Insurance Report & Dashboards

21 Nov 2023

Business Intelligence for Insurance Report & Dashboards

Find out  the business intelligence advantages in insurance for successful management of any size businesses up to widely developed ones.   ...

Read More
Manufacturing Business Intelligence: Optimizing Production with Data-Driven Insights

21 Feb 2023

Manufacturing Business Intelligence: Optimizing Production with Data-Driven Insights

The Power BI tools have shown their significance for the decision makers because they are available from any point in the world, and are reg ...

Read More
Case study. Find a BI solution for a Fashion Retail company

09 Mar 2022

Case study. Find a BI solution for a Fashion Retail company

The purpose of implementing Power BI in retail: Fix the malfunctions in the current analytics software. Refine the existing add-on that ext ...

Read More
ERP vs BI: 5 Fundamental Distinctions

22 Jan 2022

ERP vs BI: 5 Fundamental Distinctions

Is there any point to install a BI system and pay a pretty penny? Why do it when our financial specialists and accountants can do the report ...

Read More

we know 47 indicators

NECESSARY FOR EVERY BUSINESS

business performance to monitor
Download the free checklist

business performance to monitor

ABOUT THE AUTHOR

ABOUT THE AUTHOR

Hey!

I am Dmytro Chashnyk – an expert in IT management, data analytics, AI, fintech and everything related to digital business transformation. 22+ years in IT, 8 years at CxO positions.

Absolute self-made from system administrator to CIO of the largest media holding. Left the corporate sector to create my own business.

I consider one of the best solutions. Now my company COBIT SOLUTIONS employs 22 people, the turnover of our clients is USD 10 billions annually.

What are we doing?

ASK THE AUTHOR ABOUT THE ANALYTICS

Cobit Solutions

7 YEARS IN BUSINESS INTELLIGENCE

457

dashboards created in 2025

150+

years of IT experience among employees

22

data experts & BI consultants

12B

USD annual revenue of clients that utilize our analytics solutions