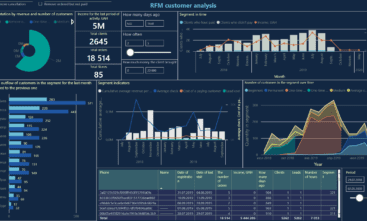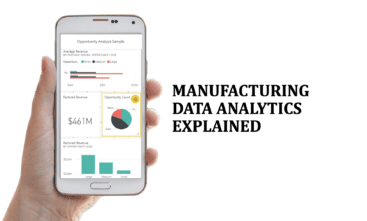
Power BI solutions for the retail industry helps business owners use the most vital data and metrics for better results.The most important fields for tracking in the retail industry are product sales, marginality and inventories.
Modern solutions such as Power BI dashboards provide retail marketers the necessary key metrics analysis and empower retailers to focus on increasing ROI.
Retail Dashboard
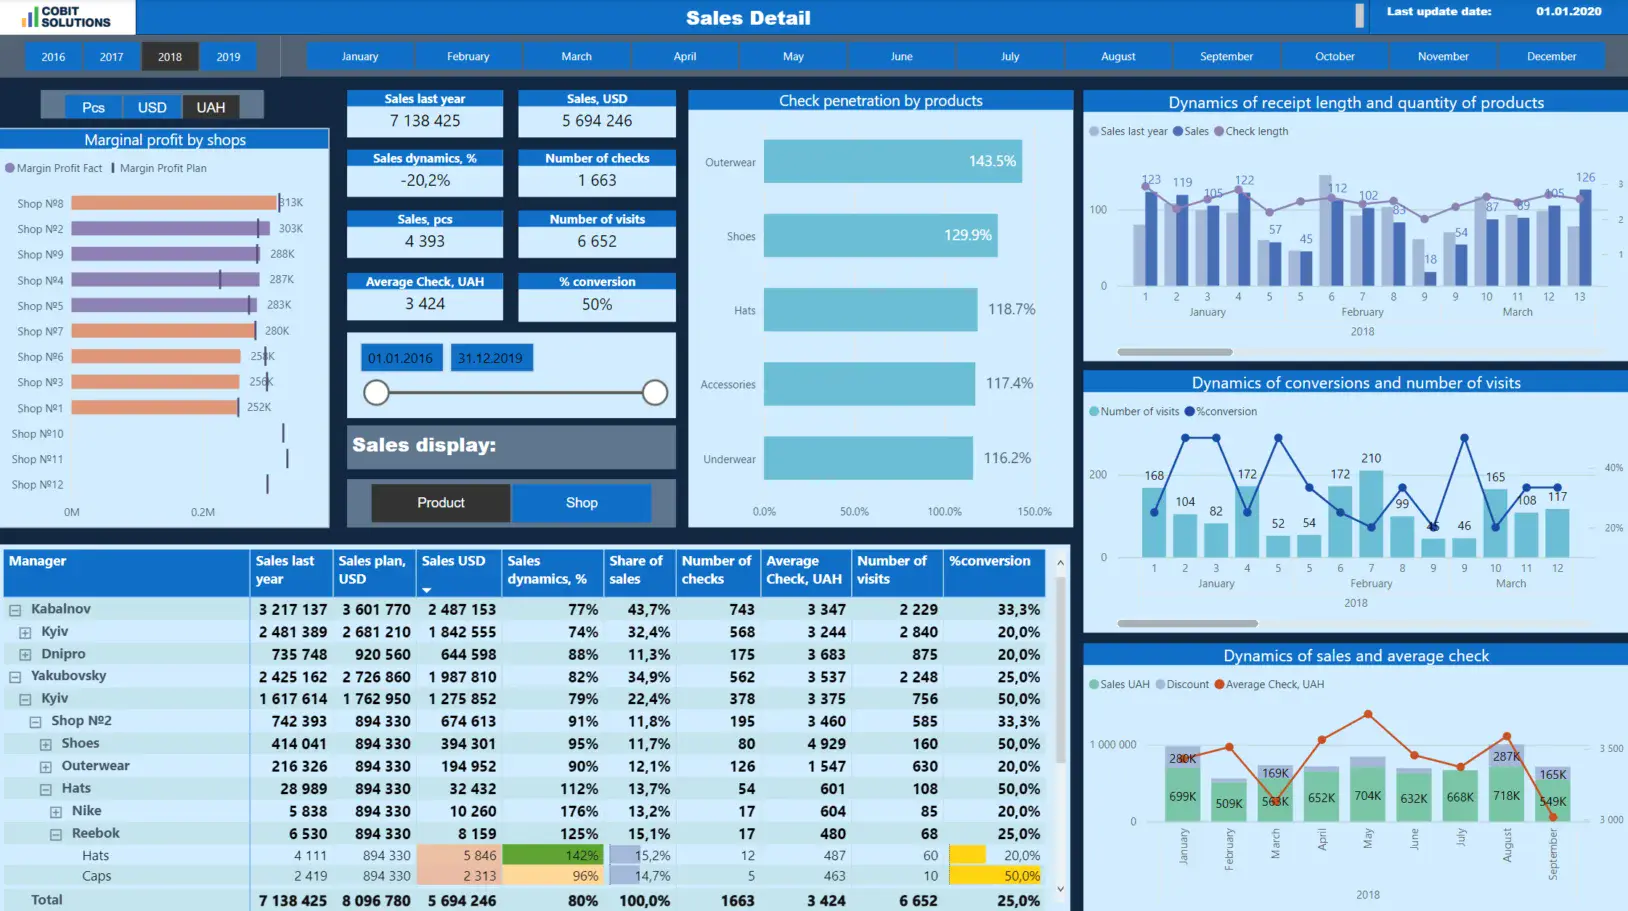
What is a Retail Dashboard?
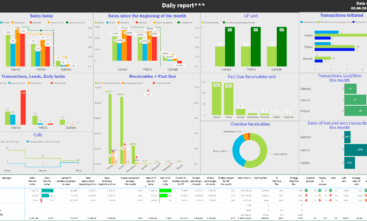
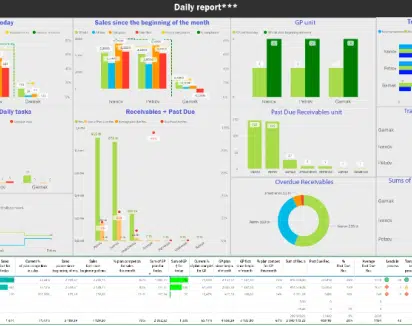
The retail analytics dashboard monitors top-selling items and provides the vital data for stock availability. It clearly illustrates the situation that necessary products are available in all stores. Retail managers can be sure to avoid hard times with out-of-stock products and supplies for customers or overstock for managers.
Inventory managers can see all the KPIs and stocks, store managers will be sure to provide items for orders placed and so on.
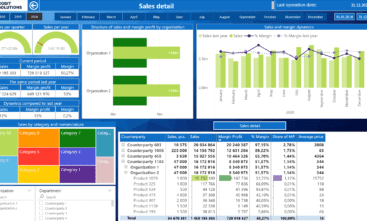
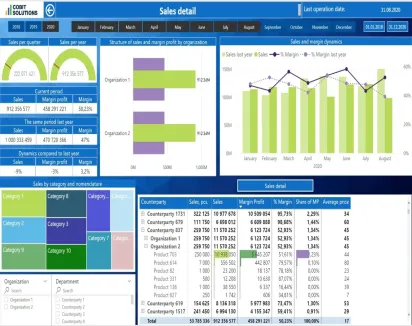
Detailed store-wise revenue analysis of interactive analytics dashboard gives best possibilities for decisions concerning future investments and store plans, which category provides higher profit despite less sales volume.
The metrics in Retail dashboard may include:
- Total sales, COGS and net sales for a selected period and selected store
- Average basket size
- Average unit in retail
- Average inventory value by product category
- Average basket value
- Visitor and buyer counts in different stores
- Sales metrics like AUR, sales per sq. ft.
- Summarized data about stock availability
- Purchase order tracking based on expected date
- Profit margin details by product category and by store
- Inventory turnover ratio
- Gross margin ROI
- Purchase orders
- Stock availability of each item
This new tool for the market has a massive impact on retail and consumer goods organizations. Our clients claim that routine monitoring ultimately leads to increased profit and to business growth. No doubt, because graphic dashboards provide a chance to control the revenue, cost price, margin and the gross profit on a daily basis.
No need to wait for a monthly report with interactive dashboards preparing freshly updated results each time you open the laptop or mobile phone.
See the retail dashboards examples to learn more about how we can help retail business owners to grow and reach great heights.
Regard more digital marketing dashboard examples to suit your needs and identify spend on and top/bottom performing products across each marketing funnel.
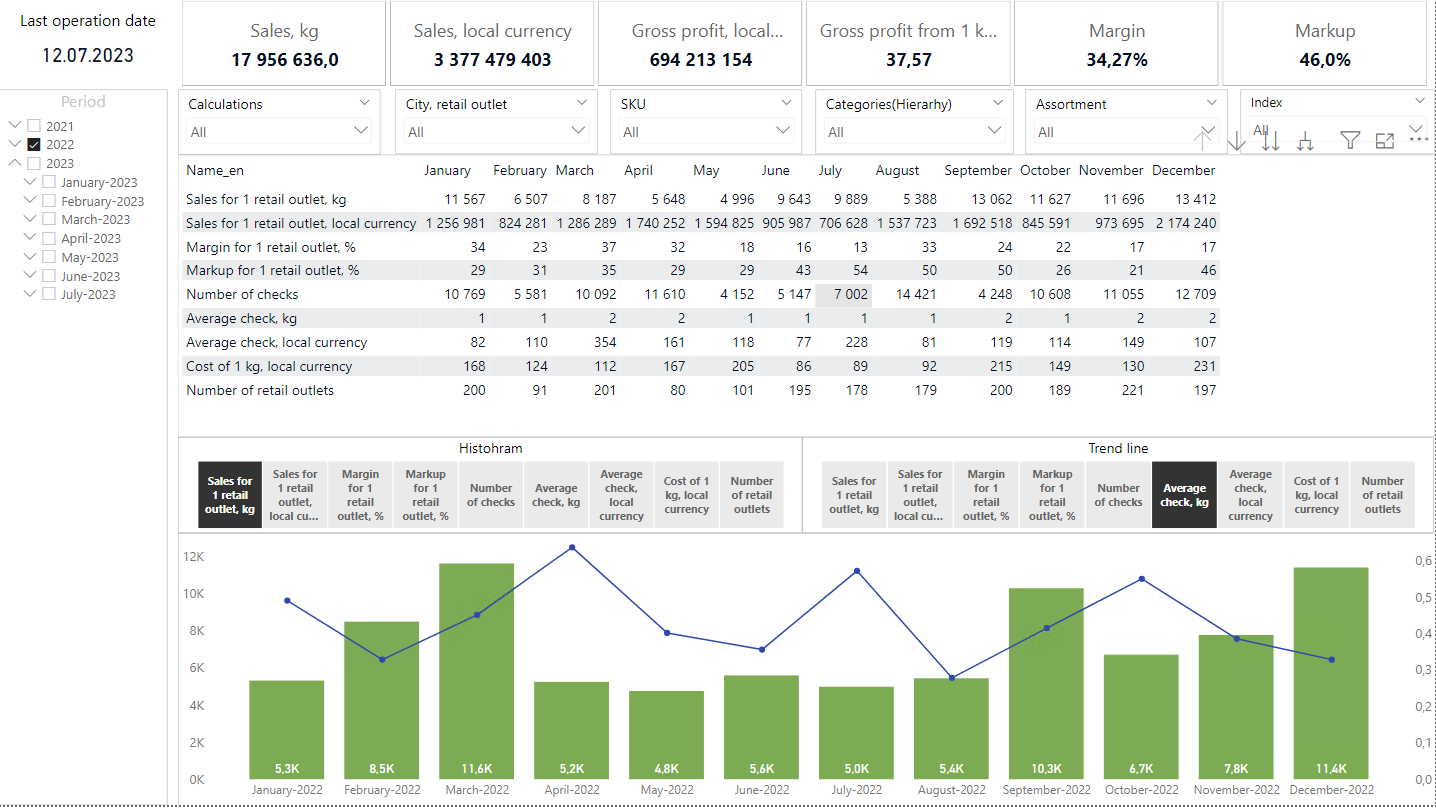
What does the Retail dashboard show and what is it for?
Retail dashboard provides a visual representation of your most recent performance metrics related to revenue and inventory. It audits the current situation, and suggests freshly updated reports for decision makers to analyze the metrics.
The adoption of modern techniques such as the retail dashboard is essential for the data driven decisions in spite of demand and supply fluctuations. Business owners may be sure to raise sales despite the weather, geographic locations, social media hype and other conditions.
It gives you a concise view of result-based reports which can reflect metrics by periods, in the regions, branches, KPIs, sales growth, and so on. Main breakdowns could be:
- dynamics
- organizations
- of vendor
- branches
- lines of business
- departments
- product groups
- order statuses
- services
- managers
General types of analyzes are not just the fact, but comparison of fact and last year, fact and plan, fact and last month, fact and deviations.
- You might also be interested how to improve overall performance in manufacturing industry
- Read more about BI consulting and advisory
Cobit Solutions Clutch Review:
What are the target roles and dashboard users?
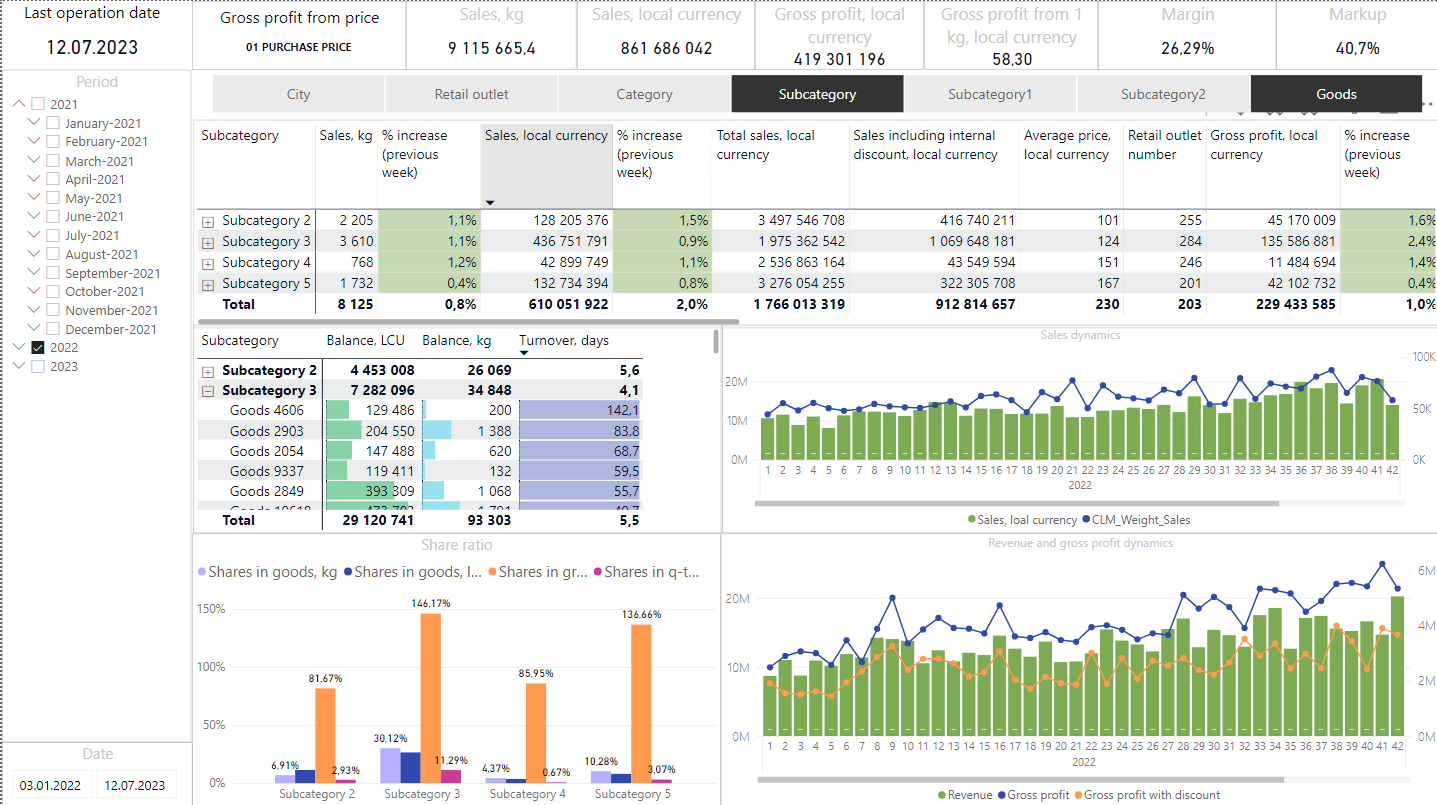
Generally all the key persons of the company need to track and provide financial control of business workflow.
Retail analytics dashboards target roles and users positions in the organization are:
- CFO
- СEO
- СOO
- financiers
- retail managers
-
head of sales,
departments - board members


Other types of retail dashboard:
![other-types [:en]other-types[:]](https://cobit-solutions.com/en/wp-content/uploads/sites/2/elementor/thumbs/other-types-qgnue2pgswv9mricvzazq6ibxfusomn01y8n3454sm.gif)
RETAIL DASHBOARD VARIATIONS
Our Power BI consultants will develop tailor made dashboards that will help effectively control sales
OUR Power BI consultancy benefits
- Leveraging best practices:
- Saving your time and money
- Power BI and data technology experts implementing turn-key data solutions
- Delivering customized dashboards crafted for your organization's needs
- 20-30% less expensive than hiring a local FTE.

Power BI, ETL, DWH Development:
![stars [:en]stars[:]](https://cobit-solutions.com/en/wp-content/uploads/sites/2/elementor/thumbs/stars-qgeqdxws1hhfn9upqdtmmw31jxbq3judwkbn7z9ec0.gif)
Turn-key BI implementation services:
ETL Data
Integration
Get the turnkey ETL data integration services for ERP, API, CRM, DB, Excel and any other IPs.
BI Dashboard
Development
Build custom dashboards tailored to business needs, including front-end interfaces and core back-end technologies.
Platform and
Infrastructure
Transforming your data silos into high-end decision-making tools on the Power BI platform for daily updated reports.
AI/ML and
Data Science
Implementing AI/ML and data science options into interactive analytics solutions that help organizations increase revenue and margins.
What's Your Stack?
