


Reporting system of management rebuilding

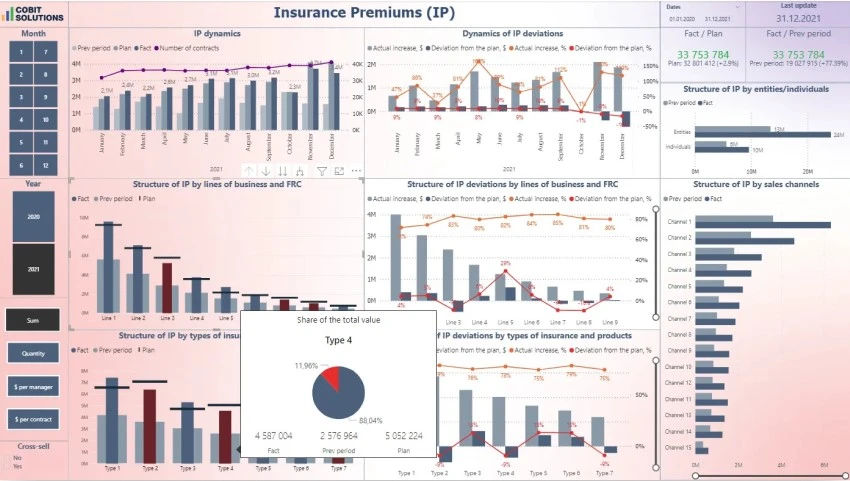
Custom specialized BI and analytics dashboards

Handy management and search of the reported data
Find out the business intelligence advantages in insurance for successful management of any size businesses up to widely developed ones.
Here is a new solution for tracking the main economic factors, indicators to control financial health. Regarding data analytics on a daily basis can boost a company’s economic success and sales.
Reporting system of management rebuilding
Custom specialized BI and analytics dashboards
Handy management and search of the reported data
We commit to deliver a comprehensive, turnkey BI & DWH solution within 4 months


22 Jan 2022
Case study: Why you Can’t Rely on Gross Income as an Indicator?A company’s profit isn’t proportionate to its income. Is this obvious? Not necessarily so. Let me share a story from my experience with a cu ...
Read More
27 Jan 2021
KPIs vs Metrics – Learn to Measure Performance and SuccessTo keep your fingers on the pulse of the most pivotal elements of a successful and implementable strategic plan you should track the perform ...
Read More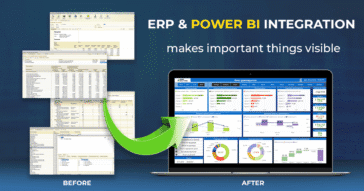
22 Jan 2022
ERP vs BI: 5 Fundamental DistinctionsIs there any point to install a BI system and pay a pretty penny? Why do it when our financial specialists and accountants can do the report ...
Read More457
dashboards created in 202587
successfully completed BI & AI projects25
data experts, BI and AI consultants12B
USD annual revenue of clients that utilize our analytics solutions