With its necessary data visualisation tools, modern business intelligence (BI) technology has completely changed the industry and enabled businesses to use their data for strategic decision-making. Leaders in this field, Tableau and Power BI, offer strong data visualisation tools. Their disparities, meanwhile, might have a big effect on how well they work for different commercial purposes. Here, we will look at the basics of these key players and compare their features. If you’re wondering about tableau vs power bi, this comparison will help you decide which is better for your needs.
Honestly, the era of data visualization tools changed the market and set new rules for essential activities to leverage companies’ data for strategic decision-making. Tableau and Power BI became the leaders who are often discussed as offering superior capabilities. All of them provide robust solutions for data visualization, however, their differences can significantly impact their suitability for various business needs. Here, we will explore the core aspects of the main players and compare their features. When considering tableau vs power bi which is better, it’s crucial to understand their unique strengths and weaknesses.

In this article, we will delve into the strengths of Tableau and Power BI, showcasing their unique features and how Cobit Solutions can help you choose the best tool for your business intelligence needs.

What is Tableau?
Tableau was developed to be an effective data visualisation tool that would facilitate clients’ intuitive understanding of their information. Its interactive interface can manage huge datasets and enables users to create rapid dashboards with shareable and interactive elements. Introduced in 2003, Salesforce eventually bought Tableau. When considering tableau vs power bi, it’s important to note that tableau vs power bi which is better is a common question among businesses looking for robust data visualization tools.
Tableau Features:
- The set of Tableau features make it a favorite among data professionals. Key features include:
- Data Connectivity: Tableau connects to a wide variety of data sources, including spreadsheets, databases, and cloud services.
- Interactive Dashboards: Users can create highly interactive and dynamic dashboards that allow for in-depth data exploration.
- Visualization Options: A rich library of visualizations including bar charts, scatter plots, and heat maps.
- Drag-and-Drop Interface: An intuitive drag-and-drop interface that simplifies the process of creating complex visualizations.
- Real-Time Data Analysis: Ability to perform real-time data analysis, helping businesses make timely decisions.
- Mobile Compatibility: Dashboards are optimized for mobile devices, ensuring accessibility on the go.
- Data Blending: Allows combining data from multiple sources into a single view.
- Collaboration Tools: Facilitates collaboration through Tableau Server and Tableau Online.
When comparing tableau vs power bi, it’s clear that tableau vs power bi which is better depends on the specific needs and preferences of the business.
Pros of Tableau
- Ease of Use: The user-friendly interface allows for easy creation of visualizations without requiring deep technical knowledge.
- Powerful Analytics: Advanced analytics capabilities, including predictive analysis.
- High Performance: Efficiently handles large datasets, providing fast and responsive visualizations.
- Customization: Extensive options for customization, enabling tailored visualizations.
- Community Support: A large and active user community providing extensive resources and support.
Cons of Tableau
❌ Cost: Tableau can be expensive, particularly for smaller organizations or individual users.
❌ Complexity for Beginners: to get powerful functions it will be hard to learn for beginners.
❌ Limited Data Preparation: Basic data preparation features compared to some competitors.
❌ Performance Issues: Performance can degrade with very large datasets or complex visualizations.
❌ Dependency on Data Source Performance: Tableau speed of visualizations can be heavily dependent on the performance of the underlying data sources.
What is Power BI?

Selecting Power BI, a Microsoft business analytics product, involves choosing interactive visuals and intuitive user interface business intelligence capabilities. As Power BI can link to several data sources, its dashboards and reports are highly regarded. For other companies, its reasonable pricing and integration with other Microsoft products make it the ideal option. When considering tableau vs power bi, it’s evident that tableau vs power bi which is better is a frequent query among businesses.
Power BI Features
Power BI users get an essential set of features, including:
- Integration with Microsoft Ecosystem: Seamless integration with Office 365, Azure, and other Microsoft services.
- Data Connectivity: Connects to various data sources, including Excel, SQL Server, and cloud-based sources like Azure and Google Analytics.
- Interactive Dashboards: Highly interactive and customizable dashboards.
- Natural Language Query: Allows users to ask questions about their data in natural language.
- AI Capabilities: Built-in AI features for data modeling and predictive analytics.
- Data Modeling: Robust data modeling capabilities, including DAX (Data Analysis Expressions) for complex calculations.
- Real-Time Data: Real-time streaming and updating of dashboards.
- Mobile Access: Fully optimized for mobile devices.
When comparing tableau vs power bi, it’s clear that understanding tableau vs power bi which is better depends on the specific needs and context of your business.
In addition to the above mentioned core features, Power BI easily competes in providing an enhanced user experience and advanced reporting capabilities:
- Custom Visualizations: Access to a marketplace of custom visuals created by the community.
- Reporting Services: Power BI Report Server for on-premises report publishing and distribution.
- Collaboration and Sharing: Integrated tools for collaboration and sharing reports within an organization.
- Embedded Analytics: Ability to embed Power BI reports into web applications or other software products.
- Security: Advanced security features, including row-level security and integration with Active Directory.
Companies Using Power BI?
Power BI is widely adopted by organizations across various sectors. Some of the prominent users include:
- Adobe
- Heathrow Airport
- GE Healthcare
- Rolls-Royce
- Kraft Heinz
- Dell
These companies utilize Power BI for its robust analytics capabilities and seamless integration with other Microsoft products.
Pros of Power BI
- Cost-Effective: More affordable compared to many other BI tools, including Tableau.
- Integration: Excellent integration with the Microsoft ecosystem, enhancing productivity for organizations already using Microsoft products.
- Ease of Use: Intuitive interface with drag-and-drop functionality and natural language querying.
- Scalability: Scales well from small to large enterprises.
- Real-Time Insights: Real-time data streaming capabilities for up-to-date analytics.
Cons of Power BI
❌Complexity in Advanced Features: Some advanced features can be complex for new users.
❌Limited Customization: Less customizable compared to Tableau’s extensive options.
❌Dependency on the Internet if you choose a Cloud-based model requiring reliable internet connectivity.
❌Learning Curve for Non-Microsoft Users: Users unfamiliar with Microsoft products might find the initial learning curve steep.
DOWNLOAD FREE CHECKLIST
of 25 recommendations for successful BI implementation


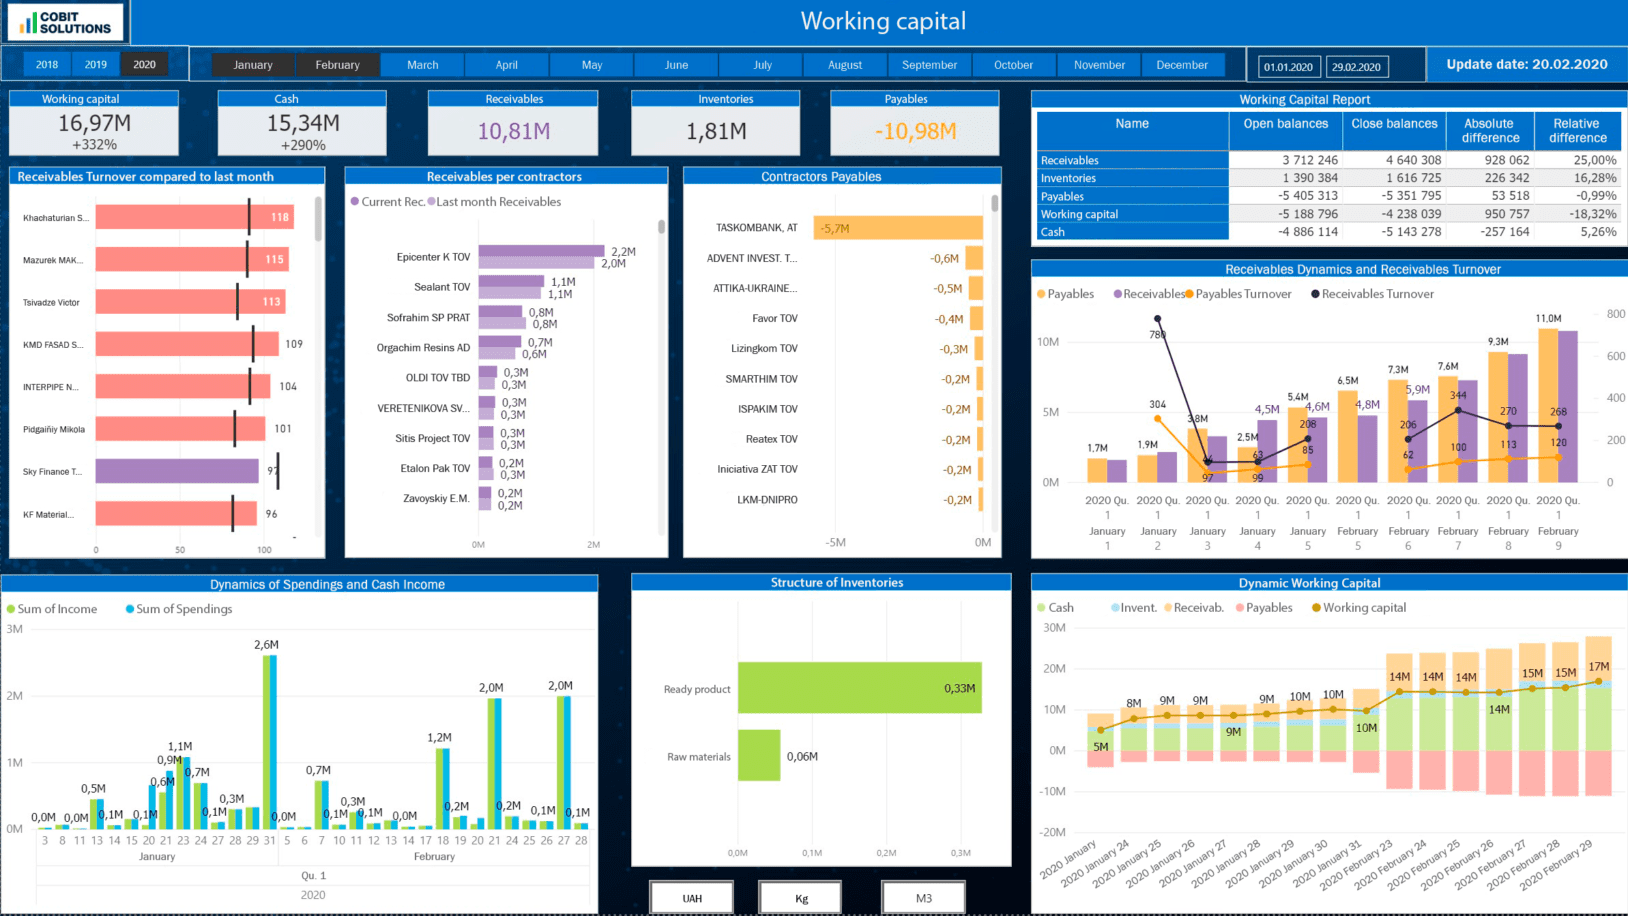
To get this vital company management tool for the working processes tracking and meeting the strategic planning you may apply to the Cobit Solutions team of professionals.
They develop dashboards for 22 industries, which allows users to view data visualizations and generate critical information that helps businesses increase production without adding more staff. Business Intelligence Consulting Cobit Solutions specialists help businesses analyze their data and provide business intelligence insights. They use a variety of data analysis techniques to generate insights such as trend analysis, key driver analysis, decomposition tree, anomaly detection, and smart narratives.
Partnering with Power BI consulting firms offers many advantages to businesses. They can bring new talent and skills to a business without disrupting existing projects and systems. This reduces operational costs and increases productivity. When comparing tableau vs power bi, it’s clear that understanding tableau vs power bi which is better can help businesses make informed decisions. Additionally, considering the benefits of tableau vs power bi consulting can further enhance business operations.
What are the Advantages of Power BI over Tableau?
As you could see both tools have their merits, however Power BI offers several advantages over Tableau:
- Cost Efficiency: Power BI is generally more cost-effective, making it accessible for smaller businesses and individual users.
- Microsoft Integration: Seamless integration with other Microsoft products like Excel, Azure, and SharePoint enhances productivity.
- Ease of Use: Power BI’s intuitive interface and natural language querying make it easier for non-technical users.
- Real-Time Data Access: Superior real-time data streaming capabilities.
- AI Features: Built-in AI and machine learning features provide advanced analytics capabilities.
Key Differences Between Power BI vs Tableau | Which One is Better?
When comparing Power BI and Tableau, several key differences emerge:
- Cost: Power BI is more affordable, offering a better cost-to-value ratio.
- Ease of Use: Power BI’s intuitive interface is more accessible for beginners, while Tableau may require more training.
- Integration: Power BI’s integration with Microsoft tools can streamline workflows for organizations already using these products.
- Customization: Tableau offers more extensive customization options, which might appeal to advanced users needing specific visualizations.
- Performance: Both tools handle large datasets well, but Power BI often provides faster performance due to its optimized integration with Azure.
- Community and Support: Tableau has a larger and more active user community, but Power BI’s community is rapidly growing.
Ultimately, the choice between Tableau and Power BI depends on your specific needs, budget, and existing technology stack. However, for organizations looking for a cost-effective, user-friendly, and highly integrated BI solution, Power BI often stands out as the better option.
To order Power BI dashboards you can fill the form on our website and client managers will connect with you for the details.
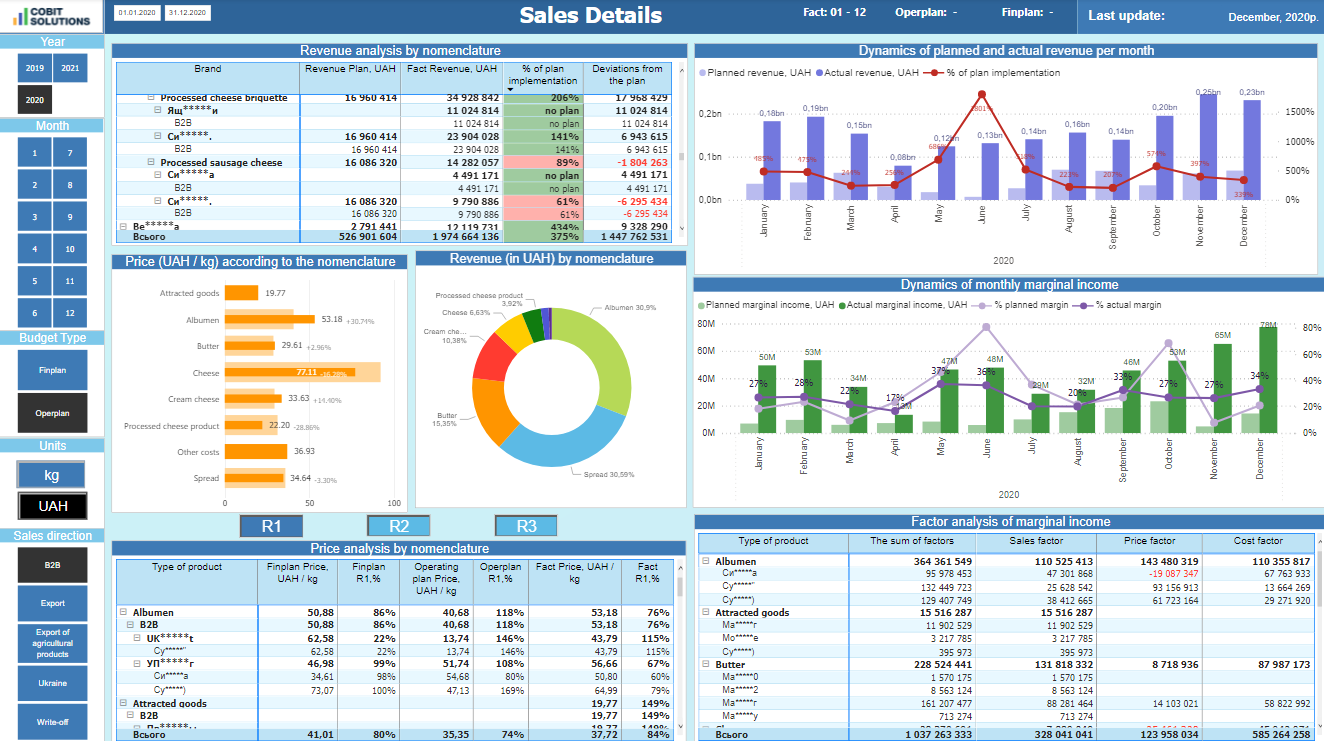
After the project starts you may get the first result over 1-1,5 months. Business intelligence in manufacturing is comfortable for usage as you can see interactive reports any time and time saving for the vital decisions of directors and other decision makers.
Dashboards don’t demand time for calculation because they show the analytical reports refreshed and ready. Just use the data when you need your Key Performance Indicators for effective management of the business. When comparing tableau vs power bi, it’s evident that tableau vs power bi which is better depends on the specific requirements of your business.
Manufacturing production reports are easy to understand because they are tailored to clients’ needs and design. Each of the department heads will get the necessary data for work and vital KPIs for the company’s success. Understanding tableau vs power bi can help you decide which tool best fits your needs, ensuring you have the right data visualization tools for your business.
The exploration of Tableau vs Power BI showed that both tools offer powerful capabilities for data visualization and business intelligence. Tableau excels in advanced customization and handling large datasets. However, Power BI’s affordability, ease of use, seamless Microsoft integration, and advanced AI features make it a compelling choice for many businesses. When choosing a BI tool, consider your specific needs, budget, and existing technology infrastructure. For many businesses, especially those already within the Microsoft ecosystem, Power BI proves to be the better option.