Home » Blog » Power BI Implementation Process

Power BI Implementation Process

How long does it take to develop one? What is the process like? What are the stages of a BI system implementation?

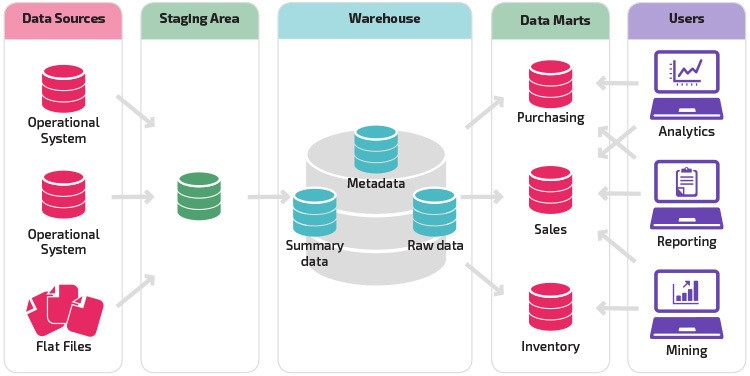
First of all, you should understand that the elegant data account for 20% of the volume of work. This is only the tip of the iceberg.

Let’s get an understanding of the process of turning Excel tables into comprehensible and appealing dashboards that contain the data on your business or subdivision.

STAGE 1
'DESIGNING THE BI ARCHITECTURE'

  1. Explore the data existing in your IT systems
  2. Make a list of the indicators and dashboards 
  3. Sketch the main dashboards and IT structure
  4. Prepare the plan for the BI implementation system project and the cost estimate.

Read more about the Power BI advantages: WHY DOES MY COMPANY NEED BUSINESS INTELLIGENCE?
 
Find out more on real cases of BI system implementation in different industries on our BLOG


Time frame: 4 weeks


STAGE 2
'IMPORTING THE DATA FROM IT SYSTEMS'

  1. Set up your systems 
  2. Create the storage structure in BI 
  3. Develop the modules for data import to BI for your data sources 
  4. Import data from different sources
  5. Formalize the existing accounting policy in the form of algorithms 
  6. Set up automatic data updates
  7. Configure a productive server for the analytics system 
  8. Prepare reconciliation dashboards 
  9. Perform data reconciliation together with your staff 
  10. Make the necessary adjustments of the data synchronization modules.

Time frame: 1-2 month

dashboard benefits


STAGE 3
'DATA VISUALIZATION AND DASHBOARDS'

  1. Discuss the detailed logic of indicator and metric calculation 
  2. Implement the specified calculation algorithms 
  3. Design the visualizations
  4. Implement the dashboard layout: the 20% that you can see 
  5. Configure the dashboards’ interactive elements 
  6. Complete the checks, demonstrate it all to the client, and make the adjustments 
  7. Teach the client’s personnel to use the dashboards and derive the economic benefits.

Time frame: 1-2 months


STAGE 4
'MAINTENANCE AND ANY OTHER WISHES YOU MAY HAVE AFTER THE BI IMPLEMENTATION'

  1. Edit the colors and the visual elements 
  2. Add filters and pop-up instructions
  3. Set up extra accesses
  4. Answer any questions that arise in the process of Power BI implementation.

Support packages starting at 10 hours per month

Read how to track the main economic factors with  BUSINESS INTELLIGENCE FOR INSURANCE 

BUT THE MAIN POINT OF THE ANALYTICS IS
PROFIT GROWTH

Our dashboards give you a chance to control the revenue, cost price, margin, gross profiе and 47 other indicators on a daily basis. No need to wait for a monthly report.

Consistent control results in  profit growth and business expansion.

GET COMPANY MANAGEMENT DASHBOARD

Cobit Solutions

More articles and cases

Power BI in healthcare case study – managers keep their finger on the pulse

14 Jan 2022

Power BI in healthcare case study – managers keep their finger on the pulse

The dashboards hepled each of the managers at their level to receive the daily reporting they needed in dashboards, by the time they came to ...

Read More
A BI System ≠ IT: Why is it so?

22 Jan 2022

A BI System ≠ IT: Why is it so?

The development of interactive dashboards is sometimes viewed as a purely IT product. This is a misconception. When developing a BI system f ...

Read More
Business Intelligence for Insurance Report & Dashboards

21 Nov 2023

Business Intelligence for Insurance Report & Dashboards

Find out  the business intelligence advantages in insurance for successful management of any size businesses up to widely developed ones.   ...

Read More

KEY FIGURES OF THE COMPANY

457

dashboards created in 2022

150+

years of IT experience among employees

17

data experts & BI consultants

12B

USD annual revenue of clients that utilize our analytics solutions