
This is the case of Helen Marlen Group — a leader of Ukrainian fashion retail representing over 190 international brands of clothes, footwear, accessories and seasonal consumer goods. This number includes 30 brands exclusively represented in Helen Marlen group stores.
This company has very progressive management: not only do they constantly follow the trends in fashion, but they’re keenly interested in arts and culture, they support the activists and contribute to the urban improvements in Kyiv. You might have heard that back in 2005 this company opened a shopping zone as part of a massive Passage Luxury Destination project.
Today we’re sharing a case of implementing Power BI retal system in the fashion industry. What’s interesting about this case is that we had to start off on a platform created by someone else. But let’s start from the beginning.
Why retail companies need Power BI analytics
Strengths & weaknesses of a business
Compare indicators per each season
Most in-demand collections
Best performing employees
In order to run a thriving business, one has to be open to the new data and be willing to implement cutting edge technologies on a constant basis. We were lucky enough to get to know the owners and top managers of this company. We worked particularly closely with Sergey Tupcalo – a CFO of Helen Marlen Group – a highly progressive leader, who knows that clear and visually comprehensible data and what it takes to achieve the financial results and quickly achieve business goals.
The issues Helen Marlen Group faced are just as important to any store selling collections in malls from Mumbai to New York. They need to keep expanding the target audience that follows the trends. Which is why we’ve prepared a case with the Power BI retail tools that address these issues.
The purpose of implementing Power BI in retail
- Eliminate the malfunctions in current analytics software
- Refine the existing add-on that extracts the ERP data.
- Perform routine tasks of loading reports in the dashboards.
- Save financial analysts the hassle of constantly rechecking data.
The issues the company faced
The program was there, but it didn't work properly
The company already had a program that extracted data for reporting. Sergey had his mind set on Power BI retail and by the time we met he knew how to work with it.
But the program itself malfunctioned every once in a while. The problem would often occur at the break of a season: all of sudden the data on incoming goods would get messed up.
An employee couldn't master Power BI retail
There was an idea to delegate this project to a highly motivated employee in the team, but it didn’t result in anything – this specialist lacked the skills.
He worked with a standard constructor with limited function and his experience with data base work was superficial. Without it the project wouldn’t yield the results.
Outsourcing didn't live up to the expectations
The outsourced team worked slowly, and the new tasks had to go through tons of discussions and elaborations. The analysts had to do regular data revisions and pick out mistakes.
«The contractors worked slowly. Errors occured a lot, the data wouldn’t match. ПWe had to revise everthing. It was hard to work with the results we got. Clearly the system worked but not the way we expected. Besides, I often had to dive into this project. It was hard setting technical tasks and then contributing as a QA, and as a setter of tasks, and a project manager. That’s a huge loss of time and resources. Besides, I have work of my own», — Sergey Tupcalo recalls.
GET A FREE CONSULTATION
Let's schedule a 30-minute online meeting to discuss your Business Dashboard


We were offered platform maintenance
When we, Cobit Solutions, came in with our offer, the management asked us if we’d agree to maintain the platform made by a previous contractor. We were a little concerned at first, but we took the job.
We figured out contractor's code
Eventually, we figured out what went wrong.
The contractor made an intermediate DWH database for uploading ERP data, then added to it additional filters, criteria, etc.. As a result, it took a manually written piece of code to load one SQL table. This piece of code was poorly structured and could be up to 5 pages long. If this intermediate table had a mistake, it was nearly impossible to quickly find and fix it.
We made the technology work
We fixed that. Right now Helen Marlen Group works with the previously built platform. It loads the ERP data into an intermediate base created by the previous contractor. Along with that we added a new set of ERP entities that integrate directly into Power BI retail with help of Cobit Solution’s exclusive connector. This part works way faster than the first one. Also we separated the system updates to lessen the load on ERP by fixing the settings made by the previous contractor.
We’re using a connector that allows connecting directly to Microsoft SQL base that keeps ERP data and shows all ERP objects without any filtration. Little by little we altered all intermediate elements and turned it into an up-to-date properly functioning technology. The most important part is – it’s easy to track anything: how the numbers add up, and if they don’t, then why.
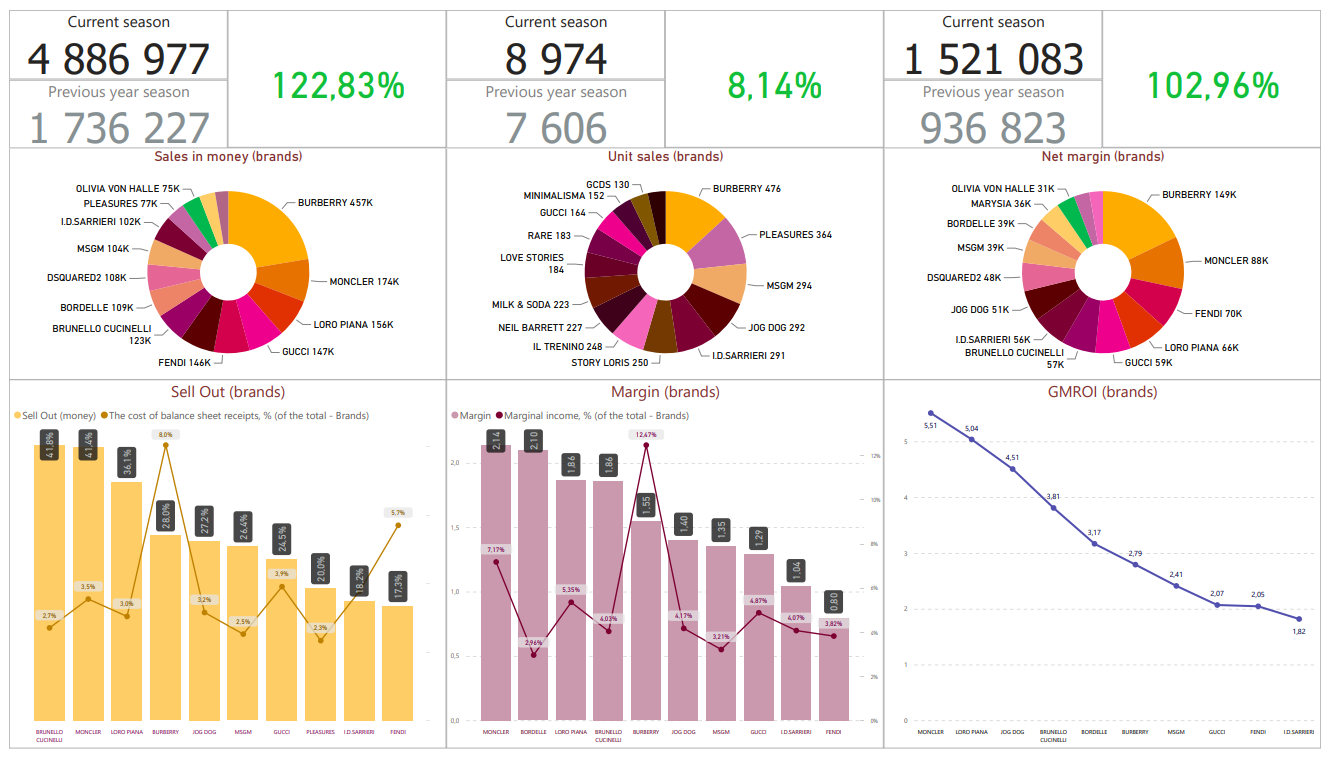
Main Indicators Dashboard
This dashboard is filled with random numbers.
It’s crucial to start from the bottom
Sergey Tupcalo comments on the implementation of the tehcnologies: “The bottom line is – how the data will be extracted from ERP and the structured data model – it’s very important. This requires utmost attention and you should only do it once – but do it right. Because if a contractor builds it with errors, you’ll probably need to redo it from scratch”
Can you do without support after implementing Power BI retail?
When our potential clients get familiar with our product and services they often ask:
- can they proceed with Power BI on their own;
- who’s better – staff developers or contractors;
- do they have to stick with Cobit Solution permanently.
Which is why we asked Sergey Tupcalo to comment on each of the questions during our interview with Helen Marlen and UMG representatives.
In-office staff or outsourcing
Sergey Tupcalo: «The first point of differentiation bases on how you’d like to proceed: do you want to develop Power BI specialists inside your own company or outsource the job. Both options have pros and cons».
- Staff workers should be highly qualified. The workload can't be unreasonably low.
- Setting the right tasks is crucial.
- Employee turnover is a possibility, and succession won't happen. When people leave part of the information disappears.
- If you're ready to use Power BI for all of your business processes and develop it on a large scale, then, probably, it's wiser to keep a staff developer.
- A specialist needs to realize right away what you mean them to do, because each busines, each branch is highly nuanced.
- It might take time to establish a common base for understanding.
- Trying to switch tasks and load a different specialist expecting them to draft a report by tomorrow is unrealistic.
- If you have an end goal in mind: you need visualization or to get operative info on several functional business areas, you might want to consider outsourcing.
Example of Convenient Work
Understand the job
I’m currently working with one of Cobit Solutions developers. I could feel it right away how her approach was different. She grasps what we want right away and does everything much faster than the guys before her. And she does it right almost immediately.
Precise visualization
If specialists lacks the feeling of precision and perfectionism, alterations take a while: the fonts are wrong, the charts aren’t what they should be, the data’s wrong.
Besides, it’s the client who pays for these fixes.
Data verification
It’s crucial to verify the data at the very beginning. Because changing the DWH data bases for your needs and explaining how this all works, how these requests have been created, how the data is extracted – it takes a lot of effort
«Best if you don’t change your partners and go with the same people till the end. That’s why, as they say, the learning curve reaches certain hight. And then, with each report, each visualization, it gets easier and more convenient to work with them», — Sergey Tupcalo.
DOWNLOAD FREE CHECKLIST
of 25 recommendations for successful BI implementation
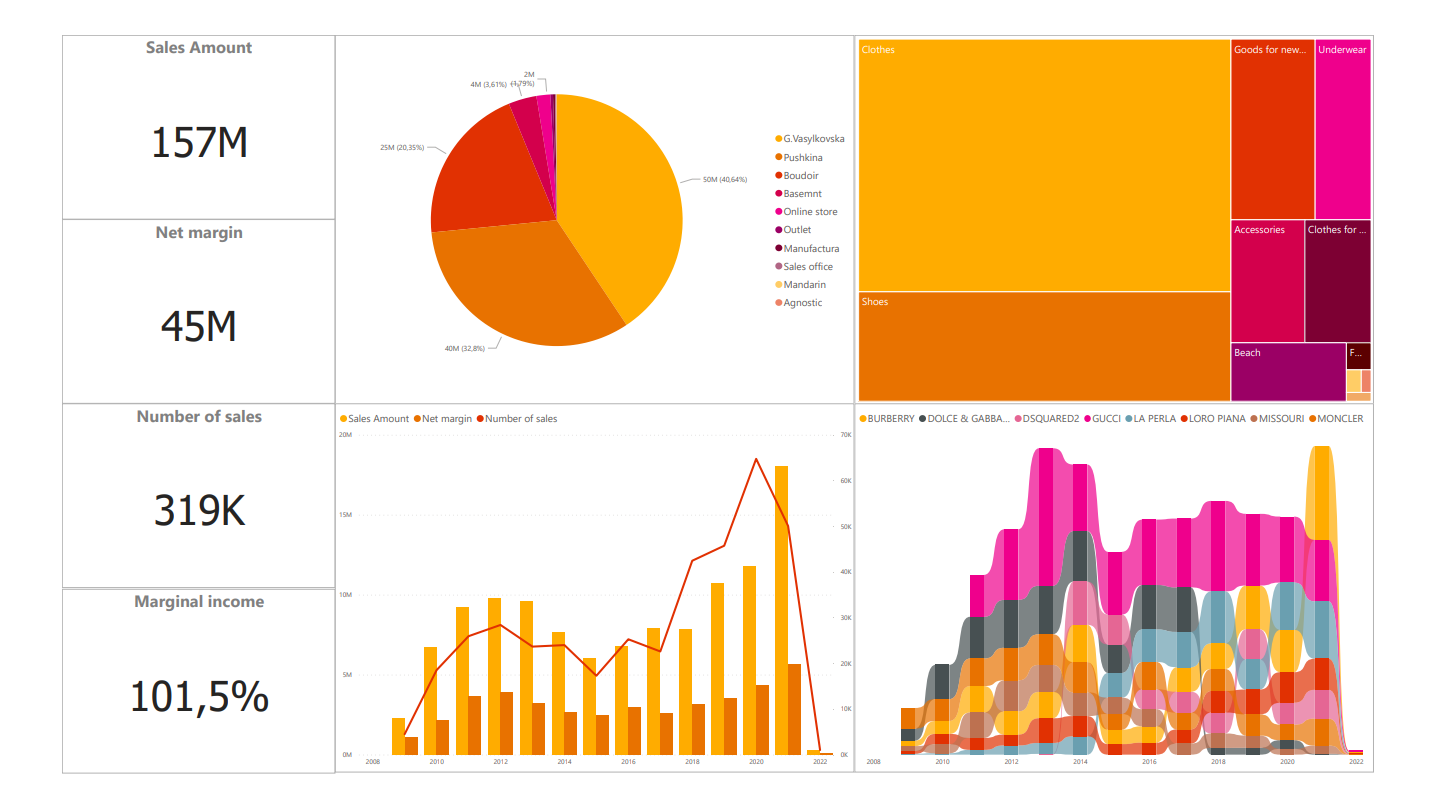
Sales dynamics dashboard
This dashboard is filled with random numbers.
How often do you need maintenance by the contractors?
- Do you need someone keeping an eye on the data so that it coinsides between different sources?
- How often do you need to do the checks – once a month or only during the testing?
- Can business function on its own without any support from the contractors?
СЕО of Cobit Solutions, Dmitriy Chashnik comments: «Normally, you need checks when you’re testing the new functions. In that moment we compare he control numbers and random ERP data and whether they coincide. I mean, after the base is set up first we introduce the comparison-check dashboards and their testing. After that, when we’re making functional dashboards, they’re first checked by a software engineer, than a financial analytics project manager. They either check the ERP data, or pick the referenc (control) numbers that we ask from a client from their current reporting.
As for Helen Marlen Group support, here’s what it covers:
- minor changes;
- program updates;
- data base recovery if they’ve timed out;
- all kinds of access;
- consults and answers».
How this story ended
Having proven ourselves with the support and improvement of the old technological solution, we expanded our cooperation with Helen Marlen Group and started working on the tasks for their separate chain of children’s clothes Baby Marlen:
- We integrated 3 ERP bases into Power BI
- We realized a BI-based financial consolidation and ingroup operations allocation. There were ingroup sales between these three bases and it was necessary to set up the analytics and calculation based on this.
- Created dashboards for sales, marginal income and gross income.
- We created a set of panels for monitoring accessible from a cellphone, which are now a must-use for the owners of the main brand (made in form of teals).
Right now we’re creating new Power BI retail dashboards for Helen Marlen Group. The last dashboard we made is a depreciation report.
«Now all my data is updated every day. I take a look from time to time, when I’m making my own report, whether the numbers coincide. Having made sure it’s alright, I just carry on with my life in peace», — says Sergey Tupcalo.
Read how to track the main economic factors with business intelligence for insurance.