

Since April 2020, we have been using Power BI in medical work with the chain of cliniсs.
It is the leading group of healthcare private cliniсs in Ukraine where patients get qualified services in 16 areas in accordance with international standards.
The management readily introduces innovations from Power BI in medicine, realizing that technology is not only a tribute to the times, but also a necessary measure for managing a colossal business. Besides, it is an opportunity to break into the forefront.
We were lucky to work mutually with a good team of professionals , in particular with the chief operating officer Vadim Shekman, head of analytics department Alexandra Karpinskaya and deputy financial director — Andrey Arbuzin.
The questions analysts and financiers of the clinic had, and how we solved them
Purpose of Power BI implementation
Medical company applied to us in order to eliminate three main problems with reporting:
- Efficiency of data acquisition.
- Data visualization.
- Budgeting forecast accuracy.
24 branches
Today, the company has 24 branches in Kyiv and the region. There are children’s, adult, and family polyclinics, hospitals, rehabilitation centers, emergency services, oncology centers, vascular surgery, and others.
1856 services
The price list of divisions includes 1856 services. Among them, there are about 60 directions in diagnostics, maintenance therapy, and plastic surgery.
54 complexes
The network of clinics includes 54 complexes in which laboratory tests, instrumental diagnostics, and consultations of narrow specialists are carried out.
GET A FREE CONSULTATION
Let's schedule a 30-minute online meeting to discuss your Business Dashboard


In fact, for effective business management it was necessary to:
Keep track of important information daily
What happens in the cabinet of each doctor, how many patients made an appointment, what services were provided, what is the percentage of offices and doctors occupied, etc.
Get operational reports
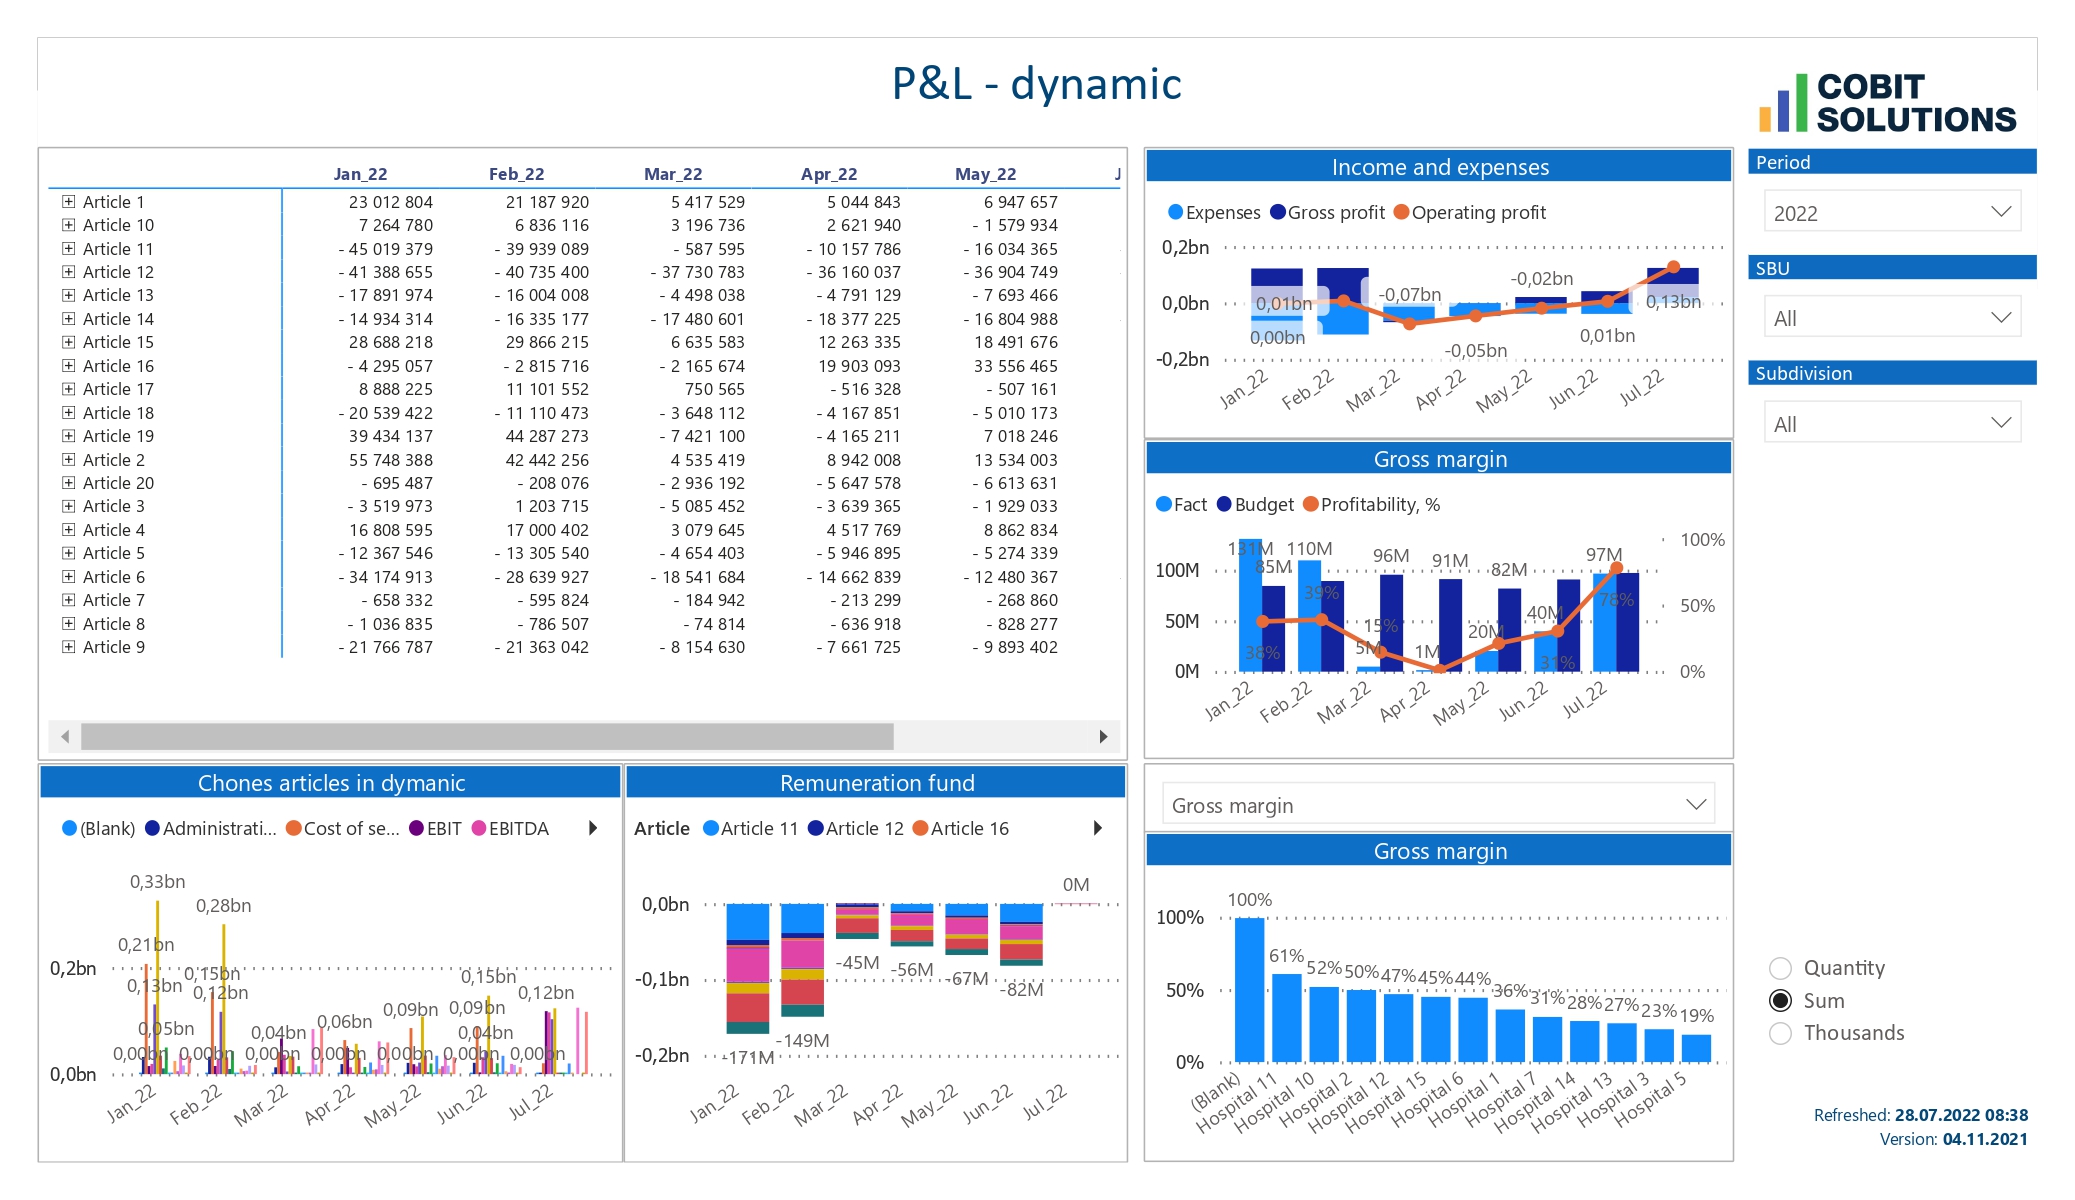
Detailed Power BI in medicine reports about financial indicators, revenue and expenditure, profit and loss.
Automate the reporting
Operational business indicators, current and projected financial results, so that staff members of the finance department will not spend weeks manually reconciling reports.
Ability to compare indexes
Compare performance between clinics that are managed decentralized. This information is especially important for department heads, top managers and CEOs.
See a holistic and clear picture
Make all reports readable and visual. Multi-page tables do not provide a complete picture and the ability to track the dynamics of indicators.
Predict the budget
Finally, get the ability to form a budget based on actual reports with profit and loss forecasts.
What was before the Power BI in medicine integration
Doctor Eleks
Initially, the company had a medical information system — «Doctor Eleks», which in fact, is the core of work in any medical clinic. It contains data of patients, registrations for appointments, procedures and other working moments. The volume of this database was about 3 TB — there are hundreds of millions of records in some tables. This system takes into account all aspects of medical activity and work planning.
However the program is limited in functions of reporting and visualization.
ERP
They also had well-implemented manual factual reporting and budgeting in ERP, since the configuration “INTALEV: Corporate Management” was implemented. The logic of these financial reports is well-organized: the cost price was thought out and taken into account to the last detail. But there were questions about the formation of reporting, since it was uploaded in Excel files, and it was all done manually.
As a result, general reporting could be provided no more than once a month, and reports for an individual clinic were made every three months.
Budgeting
We also had to set up visual reporting by comparing facts and budgets. Accounting for the financial activities of the company was carried out in “ERP: Production Management” with the configuration “INTALEV. Corporate Management” deployed on top. Its task was to ensure budgeting and data consolidation.
The forecast itself was initially not made very well; it was necessary to finish.
Therefore, the formation of P&L based on the results of daily work was out of the question. And the reporting, according to which top managers made decisions about further work, was characterized by low information content, which did not allow them to “fall through” into details and get to deeper levels of analytics. In fact, multi-page reports in the form of tables with numbers got on the tables of managers, which presented the financial result, but did not show the reasons for success or failure.
Which works made Cobit Solutions team
We imported data from system «Doctor Eleks» into Power BI, found in ERP asynchronous service directories that have 4 levels in depth and corrected errors. As a result, the data from Doctor Eleks, ERP and Excel were combined into a single system.
Cobit-Solutions connector
For synchronization with ERP, a connector specially developed by Cobit-Solutions was used. Its technology allows you to extract data directly from the MS SQL ERP database. It also gives opportunity to overview all fields, analytical sections, and characteristics that exist in ERP directories, documents, and ledgers. Any changes to the ERP data in the next update are also transferred to Power BI. Everything works without additional “intermediate base,” ETL, “unloading” and other software “crutches”.
Incremental update
Due to the large volume of the Doctor Eleks base, it was necessary to resort to its automatically replicable copy. Replication was performed to a separate analytical SQL server. Additionally as far as the data had big historical prescription, we used incremental update Microsoft Power BI. It helped us to update daily information in the last 6 months only instead of updating the entire story for 5 years. Thus the developers simultaneously received the necessary information in Power BI and ensured the uninterrupted operation of the productive base “Dr. Eleks.”
Innovative calculation scheme
Within the initial project we offered the innovative decision — separate calculation scheme P&L in Excel for different reporting periods. Each of them used different sets of accounting entries. Basing on it Power BI builds a dynamic scheme for calculating profits and losses, depending on the specified reporting period.
Thanks to the named technologies we could complete the union of data between «Dr. Eleks» and ERP. For example, the sale of a service, which a specialist records in a medical information system, then gets into the accounting program and is processed from the point of view of financial indicators. The final data is displayed on dashboards at the request of top managers in the form of simple and visually understandable graphs.
Results of the Cobit Solutions team work
Before and after
Response rate
Visibility
Way of information receiving
Before Power BI integration
Once per 1-3 months
Files Excel for 4 levels in depth
Creating reports manually
After Power BI integration
Daily
Visual dashboards
Automatic reporting
In addition to the work done, Cobit Solutions staff trained the project team so that the company could continue to work on business intelligence with an integrated Power BI in medicine system.
DOWNLOAD FREE CHECKLIST
of 25 recommendations for successful BI implementation
What did the company get as the result of cooperation with us
Each of the managers at their level began to receive the daily reporting they needed in dashboards, by the time they came to work. According to them, this gives a complete picture of the ongoing processes in the reporting units.
Directors of clinics and top managers can see:
- indexes of staff work in their clinics,
- actual financial reporting,
- profit and loss forecast.
As a result, they can control the workload of each individual cabinet, compare the performance of employees, justify expenses, and plan a budget for the next period.
СЕО, top managers and stakeholders can study:
- expenses and income by days, months, periods,
- working indexes by all clinics,
- compare all indicators between departments.
Accordingly, they can control costs and plan a budget depending on seasonality or the efficiency of a particular clinic.
Comment of one of top-managers
Andrey Arbuzin, deputy financial director has commented Power BI implementation:
«Today we have a block of actual loss and profits report created — we already see it in Power BI. Thanks to dashboards, we can also make a forecast of our financial indicators for a month, quarter or half a year and have the opportunity to compare the actual financial result with our predicted one — to understand the completeness of the reflection of expenses and income».Started with Fix price
Cooperation of Cobit Solutions and healthcare clinics chain didn’t finish on it. In fact the company has many businesses built inside, so business analytics tasks arise continuously. Therefore, during joint productive interaction, the priorities of the company began to change. And if firstly we cooperated on the Fix price principle – received payment for the implementation of a specific project, then in November 2020 everything changed.
Moved to Agile model
The management of clinics chain set the task of creating a single reporting center that allows you to see both the operational data of the medical system and the financial results report intended for use by the company’s top management. From this moment the collaboration moved to the Agile model, so that new implementation results appear in the reporting system every week.
At the current stage of cooperation, Cobit Solutions performs a certain amount of new tasks for the company on a monthly basis, which is discussed and adjusted on a weekly basis during scheduled meetings between the responsible persons of both companies.
What do we do for them now:
- blocks for PNL (reports, showing profit and losses of company),
- operating income blocks,
- units on emergency care and other indicators for heads of clinics and directions.
To start the project implementation for your company use Power BI consulting services.
Read how to track the main economic factors with BUSINESS INTELLIGENCE FOR INSURANCE
MAIN IN ANALYTICS IS — PROFIT GROWTH
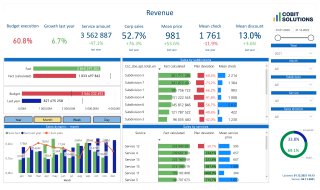
Our dashboards allow you to control revenue, cost, margin, gross profit and 47 other business indicators every day without waiting for the monthly “reconciliation” of reporting.
Regular control finally leads to profit increase and business growth.


![[:en]Power BI dashboard vs report[:]](https://cobit-solutions.com/en/wp-content/uploads/sites/2/2022/08/dobrobut-emergency_random_page-0001-e1772192929258.jpg)