Home » Blog » Financial Dashboard will guide you to your financial goals

Financial Dashboard will guide you to your financial goals

Power BI financial dashboards will quickly show efficiency improvements, places to cut costs, fraud, and areas for income increases. Empower your business!


Nowadays business companies have a sea of data, metrics, vital indexes and strive to put them together for an understandable picture.  Power BI financial dashboard is the key for such cases. To get a plethora of data the interactive dashboard collects all the information and visualizations to your daily updated report.

Financial dashboard will guide you to your financial goals showing the state of your business and financial health.

What is a Finance Dashboard?

It is a visualization tool that makes it easier to identify trends and spot potential issues. Power BI’s advanced data analytics helps our clients look for efficiency improvements, places to cut costs, fraud, and areas for increases in income.

The P&L report is connected with the calculation of sales, gross profit, financial incomes, and expenses to get the net profit.

The main metrics here are revenues from sales, cost of goods sold, gross profit and expenses of the company connected with operational (administrative salaries, rents, etc.) and non-operational activity, financial and other incomes, and costs to calculate net profit. Net profit is the result of P&L.
Cost of sales is not always shown by products, because there are general manufacturing expenses too. Moreover, manufacturing companies can use different principles to define Cost.
The Cashflow report clearly illustrates the situation why the company finishes the year with a profit but with no money in its accounts.

Factorial Analysis

It shows how the sales in units, the price, the discounts, the dollar exchange rate, the production cost, the expenditures on marketing, distribution, logistics, and other factors influence the aggregate financial result.

It enables the company to:

The main metrics in financial dashboards may include:

What does the Financial reporting dashboard show and what is it for?

In general it provides a chance to control the revenue, cost price, margin, the gross profit and other financial performance metrics and KPIs. There are three financial dashboard examples: P&L dashboard, Cashflow dashboard and Factorial Analysis to full-featured report consolidation for a group of companies.


All the mentioned above interactive reports give you vital KPIs any time updated and consolidated into a one screen reflecting your company’s financial state.

It gives you a concise view of result based reports which can reflect metrics by dates, in the regions, branches, KPIs, sales growth, and so on.

Main breakdowns could be:

General types of analyses are not just the fact, but also comparison of fact and last year, fact and plan, fact and last month, fact and deviations.

See more digital marketing dashboard examples to suit your needs and identify spend on and top/bottom performing products across each marketing funnel.


What are the target roles and dashboard users?

Clutch Review:

Number of Reviews

16

Project Cost Range

$

10.000

to

49.000

Average Referral Rating

5/

5

What does the Financial reporting dashboard show and what is it for?

Generally, all the key persons of the company need to track and provide financial control of business workflow. 

Financial dashboards  target roles and users positions in the organization are:

Cobit Solutions has an instrument that allows for identifying unobvious problems. This is often sufficient to save a business and provide it with an impulse for further development” – says Dmytro Chashnyk, CEO of Cobit Solutions, an Expert in IT with 19 years of experience, 10 years in CIO/CTO positions.

Other types of Financial dashboard:

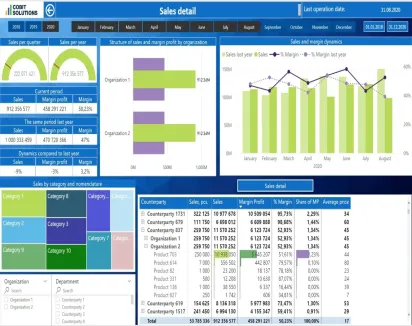
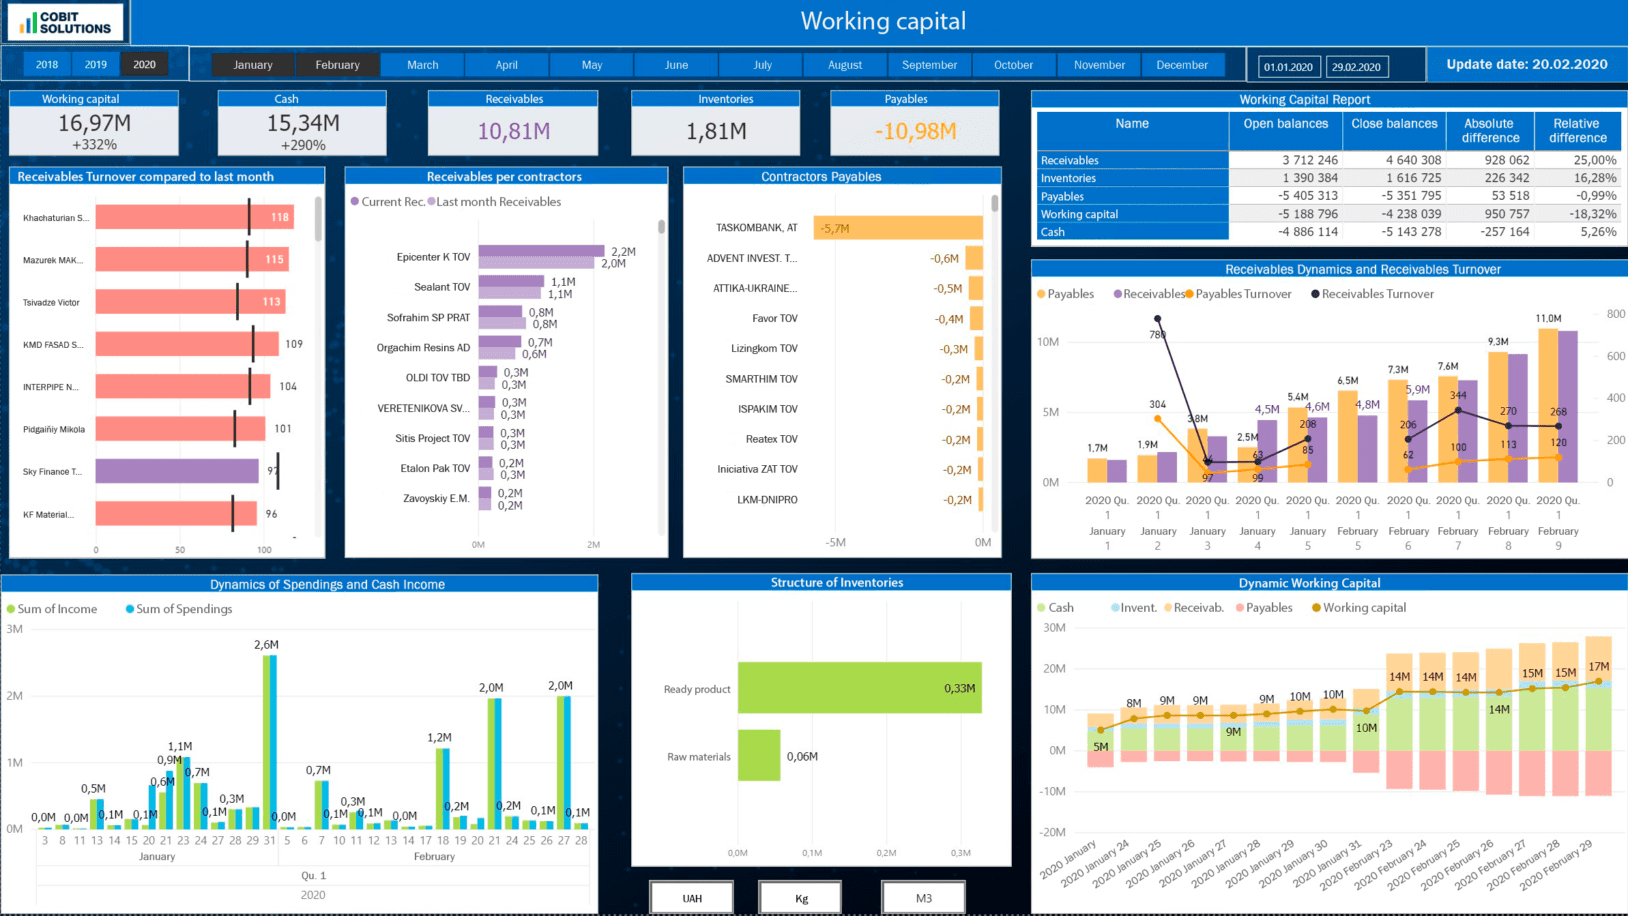
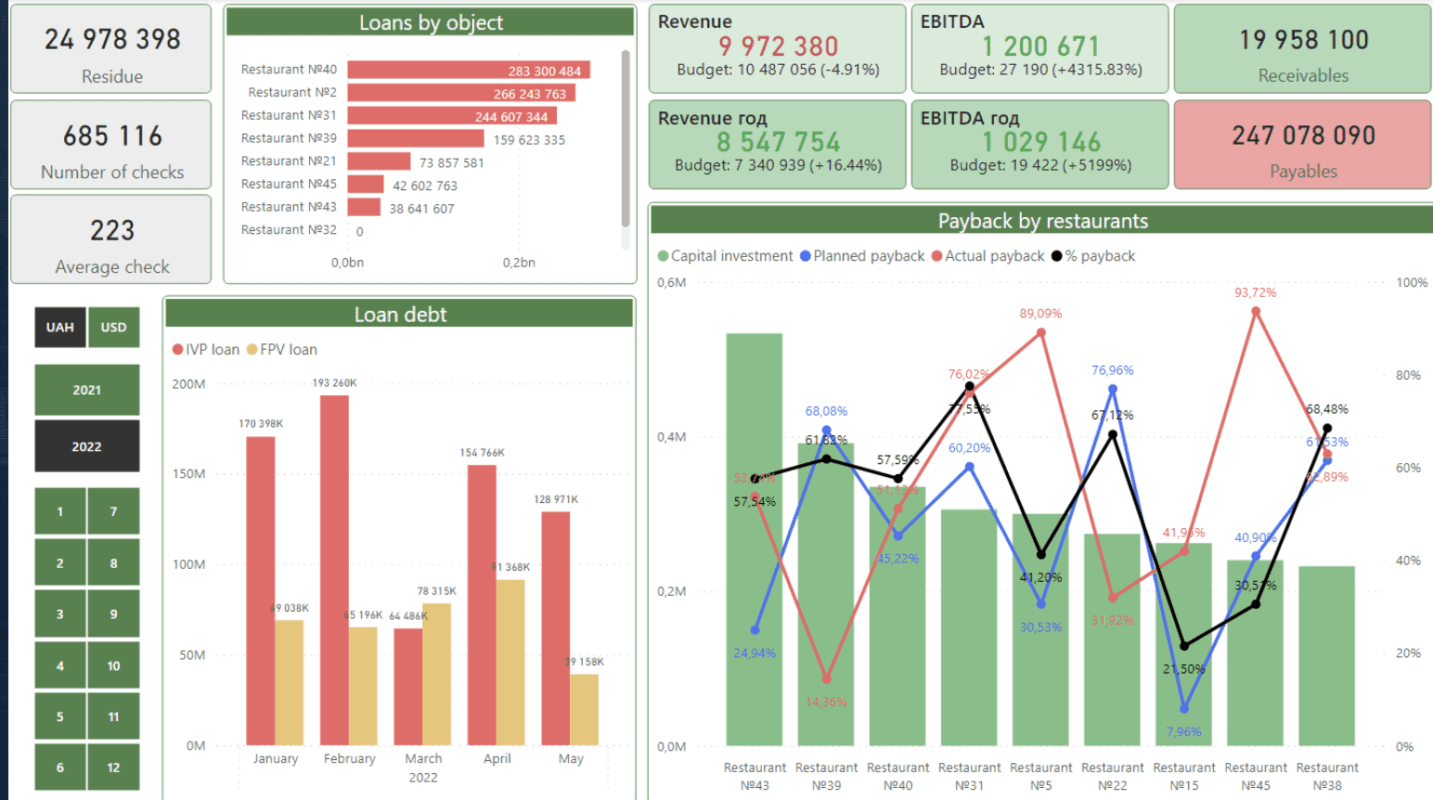
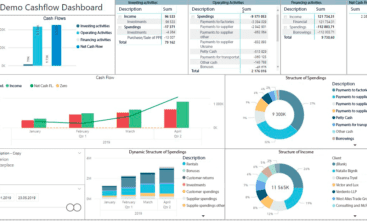
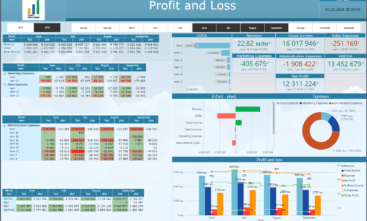
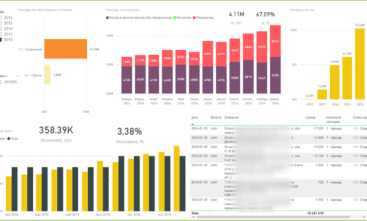
Financial DASHBOARD VARIATIONS

Our Power BI consultants will develop tailor made dashboards that will help effectively control sales

Profit & Loss (P&L)

Profit & Loss (P&L)

Profit and loss statement of the company

Opex

Opex

Analysis of operating expenses

OUR Power BI consultancy benefits

  • Leveraging best practices:
  • Saving your time and money
  • Power BI and data technology experts  implementing turn-key data solutions
  • Delivering customized dashboards crafted for your organization's needs
  • 20-30% less expensive than hiring a local FTE.


Cobit Solutions

Power BI, ETL, DWH Development:

[:en]stars[:]
Quality
5.0/5
Schedule
5.0/5
Cost
5.0/5
Willing to Reffer
5.0/5

Turn-key BI implementation services:

ETL Data
Integration

[:en]File_Code[:]

Get the turnkey ETL data integration services for ERP, API, CRM, DB, Excel and any other IPs.

BI Dashboard
Development

[:en]Note_Search[:]

Build custom dashboards tailored to business needs, including front-end interfaces and core back-end technologies.

Platform and
Infrastructure

[:en]Processor[:]

Transforming your data silos into high-end decision-making tools on the Power BI platform for daily updated reports.

AI/ML and
Data Science

[:en]Select_Multiple[:]

Implementing AI/ML and data science options into interactive analytics solutions that help organizations increase revenue and margins.

What's Your Stack?

Our development services already power over 150 active engagements. We typically land our teams within 2 weeks, so you can start shipping top-quality software, fast.

GET COMPANY MANAGEMENT DASHBOARD

Cobit Solutions

More articles and cases

Manufacturing Dashboard tracks the real state and goals achievement

29 Dec 2023

Manufacturing Dashboard tracks the real state and goals achievement

Measure the performance and success with manufacturing dashboards! Get a real picture of your key performance indicators, sales, gross margi ...

Read More
Salesforce Dashboard: Follow your Strategic Goals

04 Jan 2024

Salesforce Dashboard: Follow your Strategic Goals

The Salesforce dashboard visualizes sales metrics, clients’ detailed information, team performance for motivation and reward! Order fo ...

Read More
Sales Dashboard improves your business effectiveness

21 Nov 2023

Sales Dashboard improves your business effectiveness

Sales analytics dashboard provides a visual representation of your most recent performance, dynamics, structure and effectiveness of sales ...

Read More

KEY FIGURES OF THE COMPANY

457

dashboards created in 2022

150+

years of IT experience among employees

17

data experts & BI consultants

12B

USD annual revenue of clients that utilize our analytics solutions