







Home » Manufacturing Data & AI Solutions for Data-Driven Production

Get Powerful Manufacturing Data & AI Solutions

Based on our experience, unifying manufacturing data cuts reporting time by up to 70% and speeds up decisions by up to 90%.

Bring finance, production, and logistics together.

Bring finance, production, and logistics together.

Get consistent metrics without manual reporting.

Get consistent metrics without manual reporting.

Monitor costs, production, and supply in real time.

Monitor costs, production, and supply in real time.

Get a free consultation

on implementing analytics in production

Cobit Solutions

Drive Manufacturing Performance With Our Insights

We offer business analytics solutions for production that enable seamless coordination between finance, operations, procurement, safety, and automation.

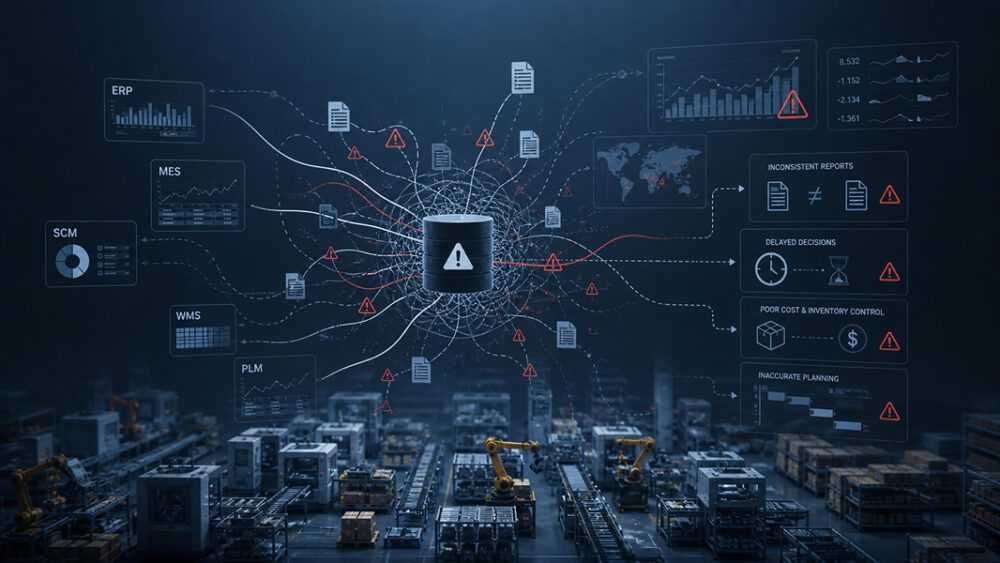
When data is not synchronized

Data Solutions for Manufacturing

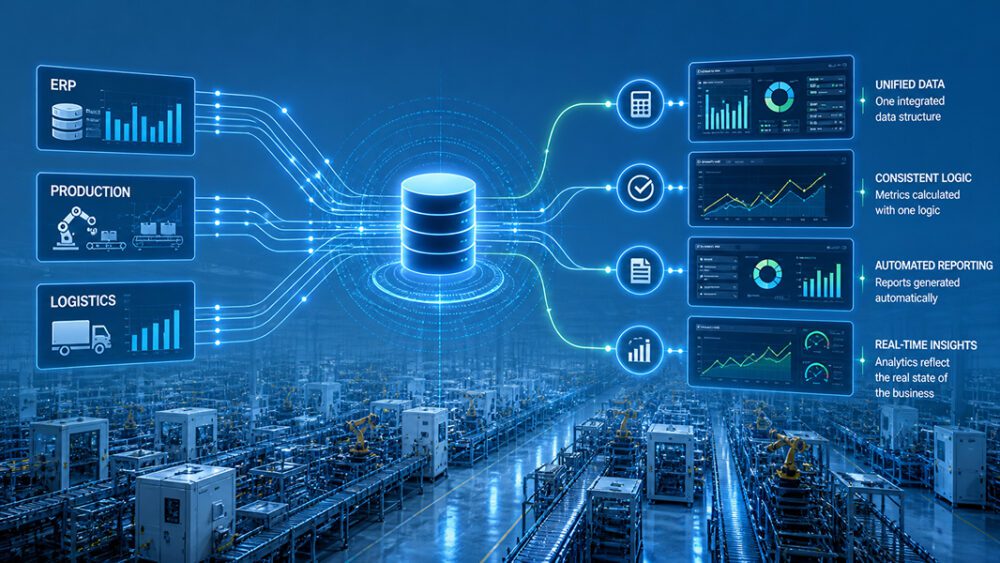
We build a system in which

Forget about manually verifying reports and data discrepancies. Work with accurate metrics and make decisions without delays.

Solutions for Production Data Analysis: Dashboards for Daily Management

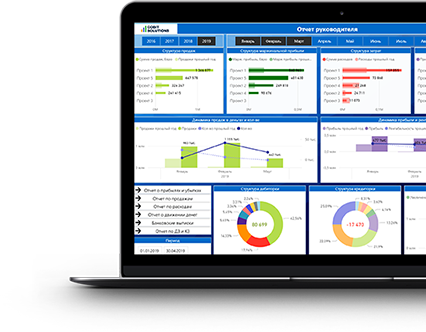
Here’s how analytics look once your data is brought together: production, cost, and sales metrics
are tracked in one system and updated automatically. Dashboards help you monitor performance,
spot issues early, and act on current data without manual effort or delays.

SPC Health Dashboard

SPC Health Dashboard

Process stability and quality metrics

Production Dashboard

Production Dashboard

Real-time production metrics and throughput analysis

Time Efficiency Dashboard

Time Efficiency Dashboard

Cycle time and output efficiency insights

OEE & Reliability Dashboard

OEE & Reliability Dashboard

Equipment performance and failure insights

Margin Drivers Dashboard

Margin Drivers Dashboard

Key factors affecting revenue and margin

Working Capital Dashboard

Working Capital Dashboard

Cash, receivables, payables, and inventory insights

Sales vs Plan Dashboard

Sales vs Plan Dashboard

Revenue and plan variance insights

Inventory Dashboard

Inventory Dashboard

Stock levels, receipts, and issues tracking

Cost Control Dashboard

Cost Control Dashboard

Expense structure and variance analysis

How our manufacturing data analytics company implements analytics in dashboards

In the dashboards, you can immediately see key metrics: your sales, expenses, inventory, plan fulfillment, and trends over time. You can change
the time period, filter data, and compare metrics without having to generate new reports. That’s because we offer customized
data solutions
for manufacturing
that take into account the specific processes of each company and ensure that only the metrics
critical to management are displayed.

Cobit Solutions
Cobit Solutions

HOW MANUFACTURING DATA ANALYTICS SERVICES ENHANCE PRODUCTION RESILIENCE

Why Companies Choose Our Data and Analytics Services for Manufacturing

Implementing analytics in manufacturing requires the coordinated integration of data, metrics, and processes. We build systems where all metrics are interconnected and reflect the true state of the business. As one of the leading manufacturing data analytics companies, we implement analytics that deliver consistent results, transparent metrics, and control at every level.

image

Quick start and initial results in just 2 weeks

image

25+ BI and Finance experts without hiring pain

image

Proven BI delivery for 8 years in 22 industries

image

More than 70 happy clients across 5 countries

image

Save 35% compared to W-2 payroll or contractors

image

Full end-to-end delivery, from reporting to support

Need a reliable analytics system for your manufacturing operations? Get a customized solution that ensures metric control, process transparency, and consistent data performance.

Technologies and approaches we use for manufacturing analytics

Analytics requires the seamless integration of data, processes, and metrics. We select the appropriate manufacturing data analytics software to handle workload, support different analysis scenarios, and keep the system stable. Data remains consistent across systems. It can be used for decision-making without additional manual checks.

Our stack for working with operational data covers the following areas:

Need to optimize your analytics system? Get a solution that takes your infrastructure into account and ensures
reliable data performance in production.
Microsoft SQL Server Logo
DAX Logo
Microsoft Azure Logo
Apache Airflow Logo
Power BI Logo
Snowflake Logo
Tabular Editor Logo
Microsoft SQL Server Logo
DAX Logo
Microsoft Azure Logo
Apache Airflow Logo
Power BI Logo
Snowflake Logo
Tabular Editor Logo

How Manufacturers Turn Data into Better Decisions

Analytics in manufacturing is transforming decision-making: metrics become transparent, processes become manageable, and results become predictable. By integrating data, companies can see exactly how costs are formed, how demand changes, and where deviations occur. We provide services and solutions for manufacturing data analysis, which include building a system with aligned metrics, automatic updates, and clear calculation logic.

Cobit Solutions Cobit Solutions

How manufacturing companies achieve results with our analytics

Data analytics consulting for manufacturing involves the systematic development of a framework in which data is harmonized, metrics are calculated according to uniform standards, and analytics is used to inform decision-making at both the process and financial levels.

image
1
Data and Process
Analysis

In the first stage, our experts analyze the current state of production data. They verify:

  • the completeness of data in the systems,
  • the consistency of data formats and types,
  • the accuracy of calculations and business logic,
  • and the consistency of metrics across departments.

The result: you see the actual state of the data and the reasons for discrepancies.

image
2
Consolidating Data into a Single System

At this stage, the project team consolidates data from ERP, production, and logistics systems into a single structure. Our specialists ensure:

  • data consistency between all systems,
  • complete integration of all data sources,
  • synchronization of periods and key indicators,
  • correctness of data transfer between systems.

The result: you work with consistent data without discrepancies between systems.

image
3
Configuring Calculation
Logic

After consolidating the data, specialists establish a unified calculation logic for the metrics. Data engineers determine:

  • the rules for calculating key metrics,
  • the alignment of metrics with business logic,
  • the consistency of metrics across departments,
  • and the accuracy of formulas and dependencies.

The result: you receive metrics that are calculated consistently across all reports.

image
4
Building Dashboards and Reports

At this stage, analysts create dashboards tailored to business objectives. They configure:

  • the structure of metrics in reports,
  • the display of metrics on dashboards,
  • filters and time-period settings,
  • and data access for different roles.

The result: you see key metrics in a single interface and quickly identify anomalies.

image
5
Launch and Real-Time Operation

After launch, engineers put the system into operational mode with automatic data updates. They ensure:

  • connection of data sources,
  • configuration of the update schedule,
  • monitoring of system performance,
  • and consistent availability of metrics.

The result: you work with up-to-date data and monitor processes in real time.

image
6
System Handover or Ongoing Support

After launch, our team will either hand over the system to you or continue to provide support. It is important to organize:

  • configuration of access rights and roles,
  • training on how to use dashboards,
  • verification of metric accuracy,
  • support and refinements as needed.

The result: you work with analytics in a convenient format.

One of the best examples of how we implemented a manufacturing analytics solution

Steelite International

An international manufacturer selling in 145 countries worked with fragmented data across 8 ERP systems and lacked a unified view of sales, inventory, and financial performance. To address this, we introduced a centralized analytics system. It brought data together, aligned key metrics, and established consistent reporting across the company.

92% reduction in reporting preparation time

Transition from manual preparation to automated report generation—from 10 days to daily updates.

65% expansion of analytical coverage

Transition from local reporting to global coverage spanning the U.S., the U.K., Canada, Europe, and Australia.

99% data accuracy in BI reports

Reconciliation of metrics with financial statements and elimination of discrepancies.

4× faster decision-making

Centralized analytics enabled a shift from monthly to regular management decisions.

Read the full case study and hear from the company’s CFO and CIO.

FAQs About Manufacturing Business
Analytics Solutions

Pricing is formed by the volume of data, the number of systems involved, and the complexity of the task. The cost of the project is also affected by the specialists involved. In most cases, the work includes an analyst, a data engineer, and a data architect. The cost of their work in our company ranges from $60 to $100, which is below the average for similar projects in the international market. At the same time, we guarantee high-quality performance. Before starting work, we determine the composition of the team and estimate the number of hours required for your tasks.

First results often appear within 2–4 weeks. Simpler setups move faster, while more complex projects with multiple data sources can take several months.

We integrate data from ERP, MES, CRM, WMS, financial systems, databases, and files. Sources may vary in format — APIs, SQL databases, or Excel — and are combined into a single structure for analysis.

Yes. The platform integrates with most ERP systems and aligns metrics with your existing data, so reporting remains consistent across systems.

Analytics enables you to work with standardized metrics, identify deviations in processes, and assess the impact of decisions on costs, inventory, and production. This reduces errors and speeds up management decision-making.