5 MAIN POWER BI REPORTS IN MANUFACTURING COMPANY

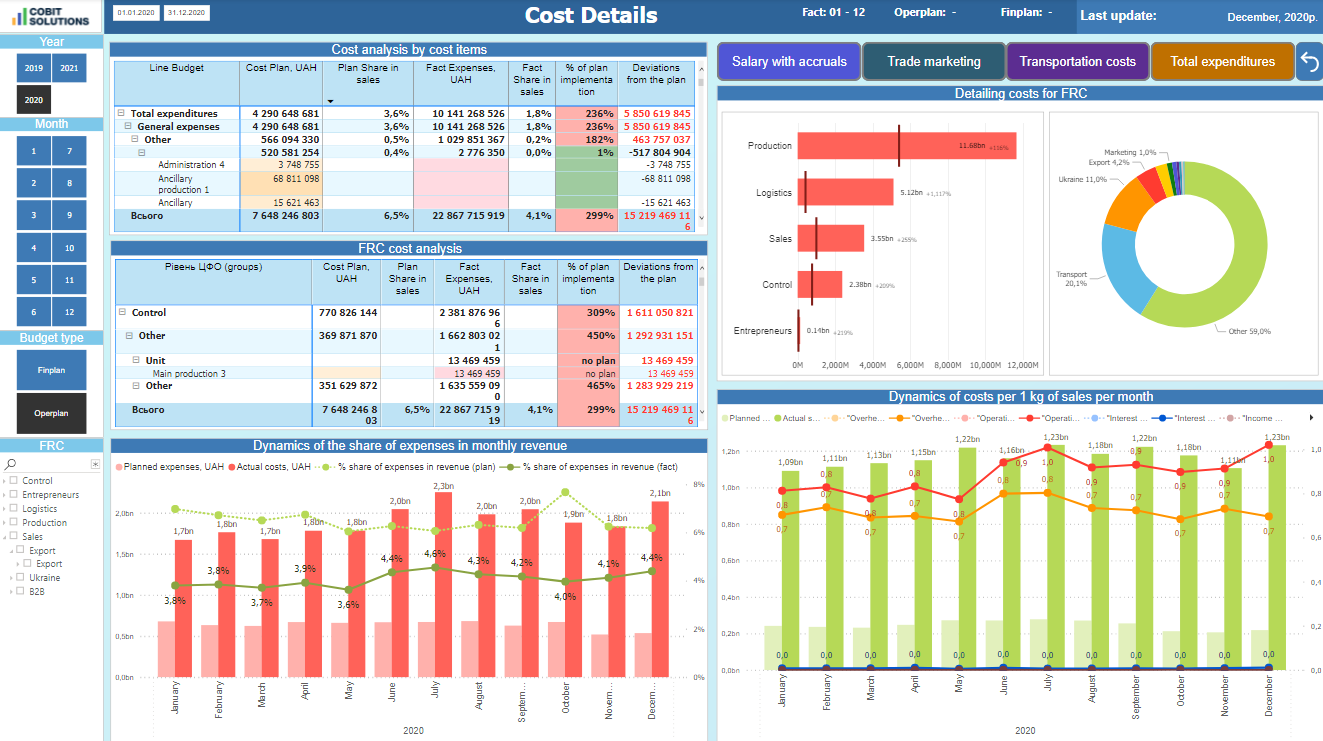
The Power BI tools have shown their significance for the decision makers because they are available from any point in the world, and are regularly updated for the moment you see the analytical report.

Manufacturing data analytics is a vital element for the company management and meeting the strategic planning. The Power business intelligence tools have shown their significance for the decision makers because they are available from any point in the world, and are regularly updated for the moment you see the analytical report. 

The managers and directors can continue their working processes until they need the dashboard data for the right decisions. At the same time data analytics for manufacturing companies will work via the cloud based service and regularly update, gather data from the ERP, API, CRM, databases, Excel and any IT systems to form the analytical reports.

Big data analytics in manufacturing includes five main dashboards you will need to check the results and correct the workflow. They are: 

  • CEO Dashboard
  • P&L dashboard,
  • Working capital dashboard,
  • Marginal income factor analysis,
  • Production Cost Details.

Dashboard 1

MANUFACTORING DASHBOARD FOR CEO

CEO dashboard is the most handy data analytics manufacturing report for the decision makers which reflects the key metrics of the company activity. 

It includes the revenue, operational profit and other structures.

Sales dynamics and level of margin, account balances, level of costs, company profitability, net profit, current state of the accounts receivable and payable will be reflected in this Power BI manufacturing dashboard

These data are analyzed in dynamics and by the main companies activity directions. On their base the CEO can estimate the main business tendencies and what happens with it daily. 

Dashboard 2

P&L dashboard is increasing financial control of manufacturing companies. To tell the truth this manufacturing kpi dashboard is important for all types of businesses. It is connected with the calculation of sales, gross profit, financial incomes and expenses to get the net profit. The main metrics here are revenues from sales, cost of goods sold, gross profit and expenses of the company connected with operational (administrative salaries, rents, etc.) and non-operational activity, financial and other incomes and costs to calculate net profit. Net profit is the result of P&L.

Cost of Goods Sold (CoGS) is not always shown by products, because there are general manufacturing expenses too. Moreover, manufacturing companies can use different principles to define Cost.

P&L manufacturing dashboard

Dashboard 3

working capital manufacturing dashboard

Working capital dashboard is an important financial index which shows the sum of shareholders’ capitals frozen in the current assets of the company. It suits all the types of companies and deals with the accounts receivable and payable, stocks and money leftovers. 

Working capital is calculated as the sum of current assets such as money leftovers, accounts receivable and inventory. Later, from this sum the short-term loan debt  is subtracted.


Finally, it reflects the sum of frozen shareholders’ capitals. When working capital is positive (10 million), it means that this sum is frozen in the current assets

Dashboard 4

Marginal income factor analysis dashboard is connected with the Revenue and Cost of goods Sold. 

Factor analysis means the affection of the sales changes (by amount, by price) and reflects which factors affected the marginal income.


Here you may see the revenue plan, factorial plan, % of plan implementation, deviations from the plan; dynamics of planned and actual revenue per month; dynamics of monthly marginal income, etc.

Marginal income factor analysis dashboard

Dashboard 5

Production cost details dashboard

Production cost details is the fifth dashboard connected with data analytics for manufacturing

It can show different limits and types of goods produced. Here are analyzed finished goods, working progress, semi-finished products, finished products, trade goods, raw materials, spare parts, fuel, etc.


In the first place, the owners get some costs for the first calculation of prime cost. Then, after the next production stage the calculations of prime cost changes with additional costs.

The advantages of Power BI dashboards

Business intelligence in manufacturing is comfortable for usage as you can see interactive reports any time in any place in the world. It is timesaving for the vital decisions of directors and other decision makers.


Dashboards don’t demand time for calculation because they show the analytical reports refreshed and ready. Just use the data when you need your Key Performance Indicators for effective management of the business. This way they save your time for the other jobs around the company and management.

Manufacturing production reports are easy to understand because they are tailored to clients’ needs and design. Each of the department heads will get the necessary data for work and vital KPIs for the company’s success. 

Reports are available from any point in the world as manufacturing dashboards use cloud based service and are regularly updated for the moment you see them. Developing the business becomes more comfortable when you regulate the workflows according to the fast reports with interactive analytics.

Dashboards creation

Whether you are implementing a new BI tool or building an entire system from scratch, Cobit Solutions team can help you meet your business intelligence needs. Our seasoned professionals will provide you with an effective BI system to make your business succeed. 

Power BI developing services can be used on a monthly or hourly basis, with subscription of fixed-price. You can leave the offer query  for our specialist to connect with you.  Let’s discuss your objective. It will cost you 40 minutes of online-meeting.

GET COMPANY MANAGEMENT DASHBOARD

Cobit Solutions

More articles and cases

POWER BI IMPLEMENTATION PROCESS.

22 Jan 2022

POWER BI IMPLEMENTATION PROCESS.

How long does it take to develop one? What is the process like? What are the stages of a BI system implementation? First of all, you should ...

Read More
A BI SYSTEM ≠ IT: WHY IS IT SO?

22 Jan 2022

A BI SYSTEM ≠ IT: WHY IS IT SO?

The development of interactive dashboards is sometimes viewed as a purely IT product. This is a misconception. When developing a BI system f ...

Read More
LOGISTICS INTELLIGENCE: HOW TO FIND A PARCEL?

22 Jan 2022

LOGISTICS INTELLIGENCE: HOW TO FIND A PARCEL?

One of the clients receives tens of thousands of parcels per month. Some of them get stuck regularly. It is practically impossible to manual ...

Read More

KEY FIGURES OF THE COMPANY

457

dashboards created in 2021

78

years of IT experience among employees

10

employees in the company

215K

USD saved by our client within a month of BI project
starting