







Home » Manufacturing Data & AI Solutions for Data-Driven Production

Get Powerful Manufacturing Data & AI Solutions

Based on our experience, unifying manufacturing data cuts reporting time by up to 70% and speeds up decisions by up to 90%.

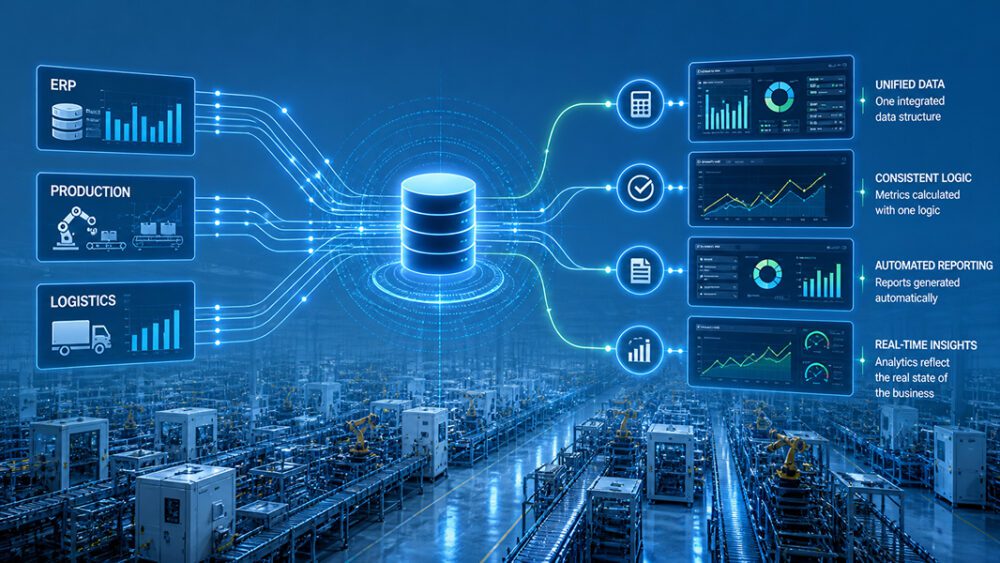
Bring finance, production, and logistics together.

Bring finance, production, and logistics together.

Get consistent metrics without manual reporting.

Get consistent metrics without manual reporting.

Monitor costs, production, and supply in real time.

Monitor costs, production, and supply in real time.

Get a free consultation

on implementing analytics in production

Solutions that drive manufacturing excellence

15 High-Impact AI & Data Solutions
for Manufacturing

From real-time visibility to AI-powered optimization, these proven solutions help manufacturers reduce
costs, eliminate downtime, improve quality, and make smarter decisions.

Predictive
Maintenance

AI system that predicts failures before they even actually happen.

Reduced Downtime

20–50%

Upkeep cost decrease

10–30%

Asset lifetime extension

20–40%

The Problem

Unexpected equipment failures cause costly downtime, disrupt production, and drive up maintenance costs.

Solutions

• Predict equipment failures
• Reduce unplanned downtime
• Lower maintenance costs
• Extend equipment lifetime

Business Example

Reducing downtime by 200 hours annually can save up to $2M for plants with 50 production lines.

Talk to an Expert

OEE & Reliability
Dashboard

Improve equipment utilization with real-time production visibility.

Higher Utilization

5–15%

Higher Throughput

5–20%

Faster Issue Detection

Faster

The Problem

Low OEE, hidden bottlenecks, and poor equipment utilization reduce overall production efficiency and profitability.

Solution

• OEE metrics in dashboard
• Bottlenecks in real time
• MTBF and MTTR across assets
• Efficiency with insights

Business Example

A 5% OEE improvement can unlock $2M–$5M in additional annual production capacity and business value.

Talk to an Expert

AI Quality Control with Computer Vision

Computer Vision detects defects before they reach customers.

Faster Inspections

50–90%

Fewer Product Defects

20–80%

Lower Labor Costs

30–70%

The Problem

Unexpected equipment failures cause costly downtime, disrupt production, and drive up maintenance costs.

Solution

• Predict Equipment Failures
• Reduce unplanned downtime
• Lower maintenance costs
• Extend equipment lifetime

Business Example

A manufacturer losing $1M annually on scrap could save approximately $300K by reducing defects by 30%.

Talk to an Expert

SPC Health
Dashboard

Monitor process stability before quality issues affect production results.

Reduced Scrap Costs

15–40%

Lower Rework Costs

10–25%

Better Process Stability

Improved

The Problem

Process drift and delayed quality detection increase scrap, rework, and overall production costs significantly.

Solutions

• Monitor control charts
• Track Cp and Cpk
• Detect process deviations
• Improve process stability

Business Example

Reducing scrap from 3% to 2% can save about $500K annually for a $50M manufacturing company.

Talk to an Expert

Production Planning
Optimization

Optimize production schedules, resources, and capacity with AI-driven planning.

Higher Throughput

10–25%

Better Schedule

15–30%

Balanced Workloads

Improved

The Problem

Frequent rescheduling, bottlenecks, and missed deadlines reduce efficiency and limit manufacturing capacity.

Solution

• Optimize production sequence
• Allocate resources efficiently
• Improve labor planning
• Balance machine loading

Business Example

A 10% throughput increase can add 1,000 units of daily production capacity to a factory producing 10,000 units.

Talk to an Expert

Inventory & Working Capital Dashboard

Reduce inventory costs while maintaining optimal stock across operations.

Reduced Inventory

10–30%

Released Capital

5–15%

Higher Turnover

Improved

The Problem

Excess inventory, stock shortages, and tied-up working capital increase costs and reduce cash flow.

Solution

• Track inventory turnover
• Optimize safety stock
• Analyze ABC/XYZ items
• Monitor inventory days

Business Example

A 15% inventory reduction can release $3M in cash from $20M of inventory assets without affecting production continuity.

Talk to an Expert

Demand
Forecasting AI

Forecast demand using AI to improve inventory and production planning.

Better Forecasts

20–50%

Lower Inventory

10–20%

Smarter Planning

Improved

The Problem

Unexpected equipment failures cause costly downtime, disrupt production, and drive up maintenance costs.

Solution

• Analyze Customer Orders
• Track Seasonal Trends
• Evaluate Sales Promotions
• Forecast Future Demand

Business Example

Reducing forecast error from 35% to 20% lowers inventory, reduces stockouts, and improves production planning.

Talk to an Expert

Supply Chain Control Tower

Monitor suppliers and shipments to prevent costly supply chain disruptions.

Fewer Shortages

10–25%

Faster Response

20–40%

Better Visibility

Real-Time

The Problem

Supplier delays, material shortages, and limited visibility disrupt production and increase operational risks.

Solution

• Monitor supplier performance
• Track shipment status
• Analyze lead times
• Detect supply risks

Business Example

Avoiding one production stoppage can save $100K–$1M+ for automotive manufacturers per incident.

Talk to an Expert

Manufacturing Cost (COGS) Analytics

Track production costs to improve margins and manufacturing profitability.

Higher Gross Margin

1–5%

Reduced Costs

Reduced

Cost Transparency

Improved

The Problem

Unknown margin leakage and rising production costs reduce profitability and limit business growth.

Solution

• Analyze material costs
• Monitor labor expenses
• Track machine costs
• Measure yield losses

Business Example

A 2% gross margin improvement can increase annual profit by $2M for a $100M manufacturer.

Talk to an Expert

Energy Monitoring & Optimization

Monitor energy usage to reduce costs and improve operational efficiency.

Lower Energy Costs

5–20%

Higher Efficiency

Improved

Peak Demand Control

Optimized

The Problem

Rising energy costs and limited visibility increase operating expenses and reduce manufacturing efficiency.

Solution

• Monitor energy consumption
• Track machine efficiency
• Detect peak demand
• Optimize energy usage

Business Example

Reducing energy costs by 10% can save $500K annually for manufacturers spending $5M on energy.

Talk to an Expert

Real-Time Machine Floor Monitoring

Monitor production in real time to detect issues before delays occur.

Higher Productivity

5–15%

Faster Issue Detection

Real-Time

Lower Downtime

Reduced

The Problem

Production issues discovered too late increase downtime, scrap, and missed delivery deadlines.

Solution

• Monitor live production status
• Track real-time throughput
• Detect downtime instantly
• Send automated alerts

Business Example

Detecting issues in 5 minutes instead of 3 hours helps prevent scrap, downtime, and missed orders.

Talk to an Expert

AI Production Yield Optimization

Increase production yield using AI to reduce waste and material losses.

Improved Yield

2–10%

Less Material Waste

Reduced

Better Process Control

Improved

The Problem

Poor production yields and excess material waste reduce profitability and increase manufacturing costs.

Solution

• Analyze machine settings
• Evaluate raw materials
• Monitor environmental factors
• Optimize production yield

Business Example

Increasing yield from 92% to 95% can generate hundreds of thousands annually for food manufacturers.

Talk to an Expert

Safety & ESG
Analytics

AI system that predicts failures before they even actually happen.

Fewer Incidents

20–50%

Faster ESG Reports

Improved

Better Compliance

Enhanced

The Problem

Safety incidents and complex ESG reporting increase risks, costs, and regulatory compliance efforts.

Solution

• Track safety incidents
• Monitor near misses
• Measure ESG metrics
• Automate ESG reporting

Business Example

Avoiding one serious safety incident can save $50K–$500K+ while reducing long-term operational risk.

Talk to an Expert

Procurement & Sourcing Analytics

Analyze procurement data to reduce costs and improve supplier performance.

Reduced Spend

3–10%

Better Suppliers

Improved

Higher Compliance

Enhanced

The Problem

Supplier price increases and maverick spending raise procurement costs and reduce contract compliance.

Solution

• Evaluate supplier performance
• Analyze price variance
• Monitor contract compliance
• Detect off-contract spending

Business Example

Reducing procurement costs by 5% can save $1.5M annually on $30M in annual purchasing spend alone.

Talk to an Expert

AI Knowledge Assistant for Operations

Use AI to find answers, solve issues, and speed employee onboarding.

Faster Support

30–70%

Faster Onboarding

20–50%

Shared Knowledge

Centralized

The Problem

Critical knowledge stays with employees, slowing onboarding, troubleshooting, and daily production support.

Solution

• Search operating procedures
• Find maintenance records
• Answer production questions
• Guide troubleshooting steps

Business Example

Saving 30 minutes daily for 20 technicians can recover 2,500+ working hours annually across the entire maintenance team.

Talk to an Expert

Your tailor-made Data Integration

Have a unique challenge?
Let's build a custom solution
for your business.

Talk to an Expert

Customized Data Analytics Solution

Have a unique challenge?
Let's build a custom solution
for your business.

Talk to an Expert

Your Custom AI Automation Solution

Have a unique challenge?
Let's build a custom solution
for your business.

Talk to an Expert

Predictive
Maintenance

AI system that predicts failures before they even actually happen.

Reduced Downtime

20–50%

Upkeep cost decrease

10–30%

Asset lifetime extension

20–40%

The Problem

Unexpected equipment failures cause costly downtime, disrupt production, and drive up maintenance costs.

Solutions

• Predict equipment failures
• Reduce unplanned downtime
• Lower maintenance costs
• Extend equipment lifetime

Business Example

Reducing downtime by 200 hours annually can save up to $2M for plants with 50 production lines.

Talk to an Expert

OEE & Reliability
Dashboard

Improve equipment utilization with real-time production visibility.

Higher Utilization

5–15%

Higher Throughput

5–20%

Faster Issue Detection

Faster

The Problem

Low OEE, hidden bottlenecks, and poor equipment utilization reduce overall production efficiency and profitability.

Solution

• OEE metrics in dashboard
• Bottlenecks in real time
• MTBF and MTTR across assets
• Efficiency with insights

Business Example

A 5% OEE improvement can unlock $2M–$5M in additional annual production capacity and business value.

Talk to an Expert

Production Planning
Optimization

Optimize production schedules, resources, and capacity with AI-driven planning.

Higher Throughput

10–25%

Better Schedule

15–30%

Balanced Workloads

Improved

The Problem

Frequent rescheduling, bottlenecks, and missed deadlines reduce efficiency and limit manufacturing capacity.

Solution

• Optimize production sequence
• Allocate resources efficiently
• Improve labor planning
• Balance machine loading

Business Example

A 10% throughput increase can add 1,000 units of daily production capacity to a factory producing 10,000 units.

Talk to an Expert

Demand
Forecasting AI

Forecast demand using AI to improve inventory and production planning.

Better Forecasts

20–50%

Lower Inventory

10–20%

Smarter Planning

Improved
The Problem

Unexpected equipment failures cause costly downtime, disrupt production, and drive up maintenance costs.

Solution

• Analyze Customer Orders
• Track Seasonal Trends
• Evaluate Sales Promotions
• Forecast Future Demand

Business Example

Reducing forecast error from 35% to 20% lowers inventory, reduces stockouts, and improves production planning.

Talk to an Expert

Inventory & Working Capital Dashboard

Reduce inventory costs while maintaining optimal stock across operations.

Reduced Inventory

10–30%

Released Capital

5–15%

Higher Turnover

Improved
The Problem

Excess inventory, stock shortages, and tied-up working capital increase costs and reduce cash flow.

Solution

• Track inventory turnover
• Optimize safety stock
• Analyze ABC/XYZ items
• Monitor inventory days

Business Example

A 15% inventory reduction can release $3M in cash from $20M of inventory assets without affecting production continuity.

Talk to an Expert

Procurement & Sourcing Analytics

Analyze procurement data to reduce costs and improve supplier performance.

Reduced Spend

3–10%

Better Suppliers

Improved

Higher Compliance

Enhanced

The Problem

Supplier price increases and maverick spending raise procurement costs and reduce contract compliance.

Solution

• Evaluate supplier performance
• Analyze price variance
• Monitor contract compliance
• Detect off-contract spending

Business Example

Reducing procurement costs by 5% can save $1.5M annually on $30M in annual purchasing spend alone.

Talk to an Expert

Real-Time Machine Floor Monitoring

Monitor production in real time to detect issues before delays occur.

Higher Productivity

5–15%

Faster Issue Detection

Real-Time

Lower Downtime

Reduced

The Problem

Production issues discovered too late increase downtime, scrap, and missed delivery deadlines.

Solution

• Monitor live production status
• Track real-time throughput
• Detect downtime instantly
• Send automated alerts

Business Example

Detecting issues in 5 minutes instead of 3 hours helps prevent scrap, downtime, and missed orders.

Talk to an Expert

Supply Chain Control Tower

Monitor suppliers and shipments to prevent costly supply chain disruptions.

Fewer Shortages

10–25%

Faster Response

20–40%

Better Visibility

Real-Time

The Problem

Supplier delays, material shortages, and limited visibility disrupt production and increase operational risks.

Solution

• Monitor supplier performance
• Track shipment status
• Analyze lead times
• Detect supply risks

Business Example

Avoiding one production stoppage can save $100K–$1M+ for automotive manufacturers per incident.

Talk to an Expert

Safety & ESG
Analytics

AI system that predicts failures before they even actually happen.

Fewer Incidents

20–50%

Faster ESG Reports

Improved
Better Compliance

Enhanced
The Problem

Safety incidents and complex ESG reporting increase risks, costs, and regulatory compliance efforts.

Solution

• Track safety incidents
• Monitor near misses
• Measure ESG metrics
• Automate ESG reporting

Business Example

Avoiding one serious safety incident can save $50K–$500K+ while reducing long-term operational risk.

Talk to an Expert

Manufacturing Cost (COGS) Analytics

Track production costs to improve margins and manufacturing profitability.

Higher Gross Margin

1–5%

Reduced Costs

Reduced

Cost Transparency

Improved

The Problem

Unknown margin leakage and rising production costs reduce profitability and limit business growth.

Solution

• Analyze material costs
• Monitor labor expenses
• Track machine costs
• Measure yield losses

Business Example

A 2% gross margin improvement can increase annual profit by $2M for a $100M manufacturer.

Talk to an Expert

Energy Monitoring & Optimization

Monitor energy usage to reduce costs and improve operational efficiency.

Lower Energy Costs

5–20%

Higher Efficiency

Improved

Peak Demand Control

Optimized

The Problem

Rising energy costs and limited visibility increase operating expenses and reduce manufacturing efficiency.

Solution

• Monitor energy consumption
• Track machine efficiency
• Detect peak demand
• Optimize energy usage

Business Example

Reducing energy costs by 10% can save $500K annually for manufacturers spending $5M on energy.

Talk to an Expert

AI Knowledge Assistant for Operations

Use AI to find answers, solve issues, and speed employee onboarding.

Faster Support

30–70%

Faster Onboarding

20–50%

Shared Knowledge

Centralized

The Problem

Critical knowledge stays with employees, slowing onboarding, troubleshooting, and daily production support.

Solution

• Search operating procedures
• Find maintenance records
• Answer production questions
• Guide troubleshooting steps

Business Example

Saving 30 minutes daily for 20 technicians can recover 2,500+ working hours annually across the entire maintenance team.

Talk to an Expert

Your tailor-made Data Integration

Have a unique challenge?
Let's build a custom solution
for your business.

Talk to an Expert

Customized Data Analytics Solution

Have a unique challenge?
Let's build a custom solution
for your business.

Talk to an Expert

Your Custom AI Automation Solution

Have a unique challenge?
Let's build a custom solution
for your business.

Talk to an Expert

Drive Manufacturing Performance With Our Insights

We offer business analytics solutions for production that enable seamless coordination between finance, operations, procurement, safety, and automation.

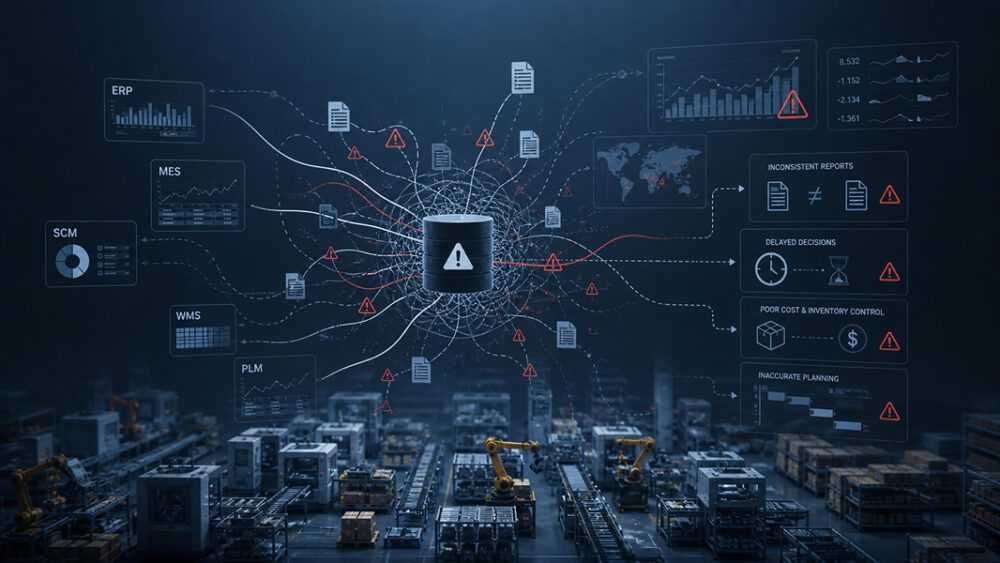
When data is not synchronized

Data Solutions for Manufacturing

We build a system in which

Forget about manually verifying reports and data discrepancies. Work with accurate metrics and make decisions without delays.

Solutions for Production Data Analysis: Dashboards for Daily Management

Here’s how analytics look once your data is brought together: production, cost, and sales metrics
are tracked in one system and updated automatically. Dashboards help you monitor performance,
spot issues early, and act on current data without manual effort or delays.

SPC Health Dashboard

SPC Health Dashboard

Process stability and quality metrics

Production Dashboard

Production Dashboard

Real-time production metrics and throughput analysis

Time Efficiency Dashboard

Time Efficiency Dashboard

Cycle time and output efficiency insights

Margin Drivers Dashboard

Margin Drivers Dashboard

Key factors affecting revenue and margin

Margin Drivers Dashboard

Margin Drivers Dashboard

Key factors affecting revenue and margin

Working Capital Dashboard

Working Capital Dashboard

Cash, receivables, payables, and inventory insights

Sales vs Plan Dashboard

Sales vs Plan Dashboard

Revenue and plan variance insights

Inventory Dashboard

Inventory Dashboard

Stock levels, receipts, and issues tracking

Cost Control Dashboard

Cost Control Dashboard

Expense structure and variance analysis

How our manufacturing data analytics company implements analytics in dashboards

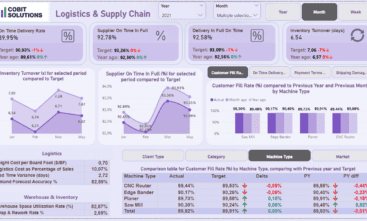
In the dashboards, you can immediately see key metrics: your sales, expenses, inventory, plan fulfillment, and trends over time. You can change
the time period, filter data, and compare metrics without having to generate new reports. That’s because we offer customized data solutions
for manufacturing that take into account the specific processes of each company and ensure that only the metrics
critical to management are displayed.

Cobit Solutions
Cobit Solutions

HOW MANUFACTURING DATA ANALYTICS SERVICES ENHANCE PRODUCTION RESILIENCE

Why Companies Choose Our Data and Analytics Services for Manufacturing

Implementing analytics in manufacturing requires the coordinated integration of data, metrics, and processes. We build systems where all metrics are interconnected and reflect the true state of the business. As one of the leading manufacturing data analytics companies, we implement analytics that deliver consistent results, transparent metrics, and control at every level.

image

Quick start and first results in just 1 week

image

25+ BI and Finance experts without hiring pain

image

Proven BI delivery for 8 years in 22 industries

image

More than 70 happy clients across 5 countries

image

Save 35% compared to W-2 payroll or contractors

image

Full end-to-end delivery, from reporting to support

Need a reliable analytics system for your manufacturing operations? Get a customized solution that ensures metric control, process transparency, and consistent data performance.

Implemented BI Analytics Solution
For Manufacturing

Steelite International

An international manufacturer selling in 145 countries worked with fragmented data across 8 ERP systems and lacked a unified view of sales, inventory, and financial performance. To address this, we introduced a centralized analytics system. It brought data together, aligned key metrics, and established consistent reporting across the company.

92% reduction in reporting preparation time

Transition from manual preparation to automated report generation—from 10 days to daily updates.

65% expansion of analytical coverage

Transition from local reporting to global coverage spanning the U.S., the U.K., Canada, Europe, and Australia.

99% data accuracy in BI reports

Reconciliation of metrics with financial statements and elimination of discrepancies.

4× faster decision-making

Centralized analytics enabled a shift from monthly to regular management decisions.

Read the full case study and hear from the company’s CFO and CIO.

Technologies and approaches we use for manufacturing analytics

Analytics requires the seamless integration of data, processes, and metrics. We select the appropriate manufacturing data analytics software to handle workload, support different analysis scenarios, and keep the system stable. Data remains consistent across systems. It can be used for decision-making without additional manual checks.

Our stack for working with operational data covers the following areas:

Need to optimize your analytics system? Get a solution that takes your infrastructure into account and ensures
reliable data performance in production.
Microsoft SQL Server Logo
DAX Logo
Microsoft Azure Logo
Apache Airflow Logo
Power BI Logo
Microsoft Azure, Amazon S3
Snowflake Logo
Tabular Editor Logo

How Manufacturers Turn Data into Better Decisions

Analytics in manufacturing is transforming decision-making: metrics become transparent, processes become manageable, and results become predictable. By integrating data, companies can see exactly how costs are formed, how demand changes, and where deviations occur. We provide services and solutions for manufacturing data analysis, which include building a system with aligned metrics, automatic updates, and clear calculation logic.

Cobit Solutions Cobit Solutions

How manufacturing companies achieve results with our analytics

Data analytics consulting for manufacturing involves the systematic development of a framework in which data is harmonized, metrics are calculated according to uniform standards, and analytics is used to inform decision-making at both the process and financial levels.

1
Data and Process
Analysis

In the first stage, our experts analyze the current state of production data. They verify:

  • the completeness of data in the systems,
  • the consistency of data formats and types,
  • the accuracy of calculations and business logic,
  • and the consistency of metrics across departments.

The result: you see the actual state of the data and the reasons for discrepancies.

2
Consolidating Data into a Single System

At this stage, the project team consolidates data from ERP, production, and logistics systems into a single structure. Our specialists ensure:

  • data consistency between all systems,
  • complete integration of all data sources,
  • synchronization of periods and key indicators,
  • correctness of data transfer between systems.

The result: you work with consistent data without discrepancies between systems.

3
Configuring Calculation
Logic

After consolidating the data, specialists establish a unified calculation logic for the metrics. Data engineers determine:

  • the rules for calculating key metrics,
  • the alignment of metrics with business logic,
  • the consistency of metrics across departments,
  • and the accuracy of formulas and dependencies.

The result: you receive metrics that are calculated consistently across all reports.

4
Building Dashboards and Reports

At this stage, analysts create dashboards tailored to business objectives. They configure:

  • the structure of metrics in reports,
  • the display of metrics on dashboards,
  • filters and time-period settings,
  • and data access for different roles.

The result: you see key metrics in a single interface and quickly identify anomalies.

5
Launch and Real-Time Operation

After launch, engineers put the system into operational mode with automatic data updates. They ensure:

  • connection of data sources,
  • configuration of the update schedule,
  • monitoring of system performance,
  • and consistent availability of metrics.

The result: you work with up-to-date data and monitor processes in real time.

Proven Track Record
6
System Handover or Ongoing Support

After launch, our team will either hand over the system to you or continue to provide support. It is important to organize:

  • configuration of access rights and roles,
  • training on how to use dashboards,
  • verification of metric accuracy,
  • support and refinements as needed.

The result: you work with analytics in a convenient format.

Testimonials for Our Business Intelligence Services

Cobit Solutions Cobit Solutions

LEAVE A REVIEW FOR OUR Manufacturing Data & AI Solutions for Data-Driven Production

4.8
Average rating
Based on 27 reviews

    FAQs About Manufacturing Business
    Analytics Solutions

    Pricing is formed by the volume of data, the number of systems involved, and the complexity of the task. The cost of the project is also affected by the specialists involved. In most cases, the work includes an analyst, a data engineer, and a data architect. The cost of their work in our company ranges from $60 to $100, which is below the average for similar projects in the international market. At the same time, we guarantee high-quality performance. Before starting work, we determine the composition of the team and estimate the number of hours required for your tasks.

    First results often appear within 2–4 weeks. Simpler setups move faster, while more complex projects with multiple data sources can take several months.

    We integrate data from ERP, MES, CRM, WMS, financial systems, databases, and files. Sources may vary in format — APIs, SQL databases, or Excel — and are combined into a single structure for analysis.

    Yes. The platform integrates with most ERP systems and aligns metrics with your existing data, so reporting remains consistent across systems.

    Analytics enables you to work with standardized metrics, identify deviations in processes, and assess the impact of decisions on costs, inventory, and production. This reduces errors and speeds up management decision-making.