

Home » Blog » How More Than 100 Stores Got Faster Analytics in Power BI

How a 100+ Store GROCERY Chain Moved Analytics into Power BI

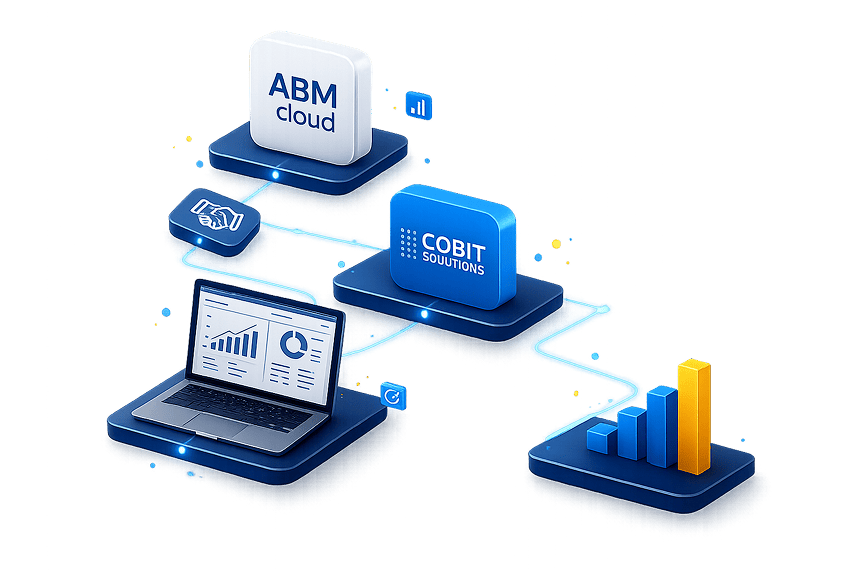
Grosh, a regional grocery retail leader with 100+ stores, needed faster reporting without overloading its ERP system. Cobit Solutions helped the company move critical analytics from ABM Cloud to Power BI, build a separate data processing layer, and automate routine Excel work.

Discuss a Similar Project
View results →

900M+
rows processed in
1.5 hours

Retail

100+ stores, high transaction volume, daily operational data.

ERP

ABM Cloud remained the core operational system.

BI

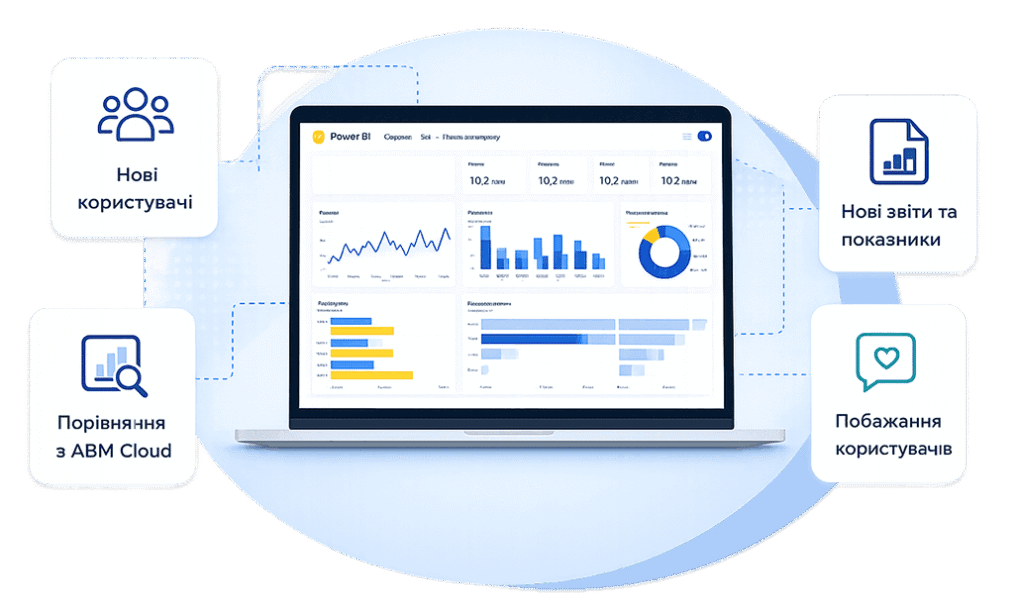
Power BI became the new analytics layer for users.

Scale

The solution was prepared for further BI development.

100+ stores in one analytics ecosystem

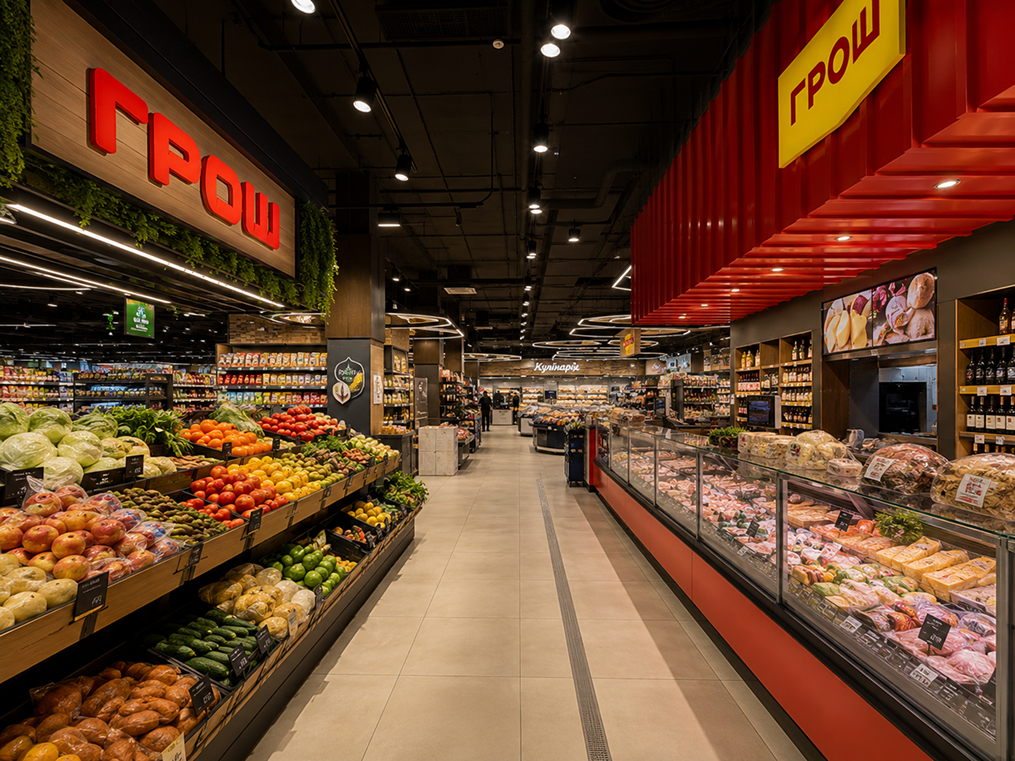
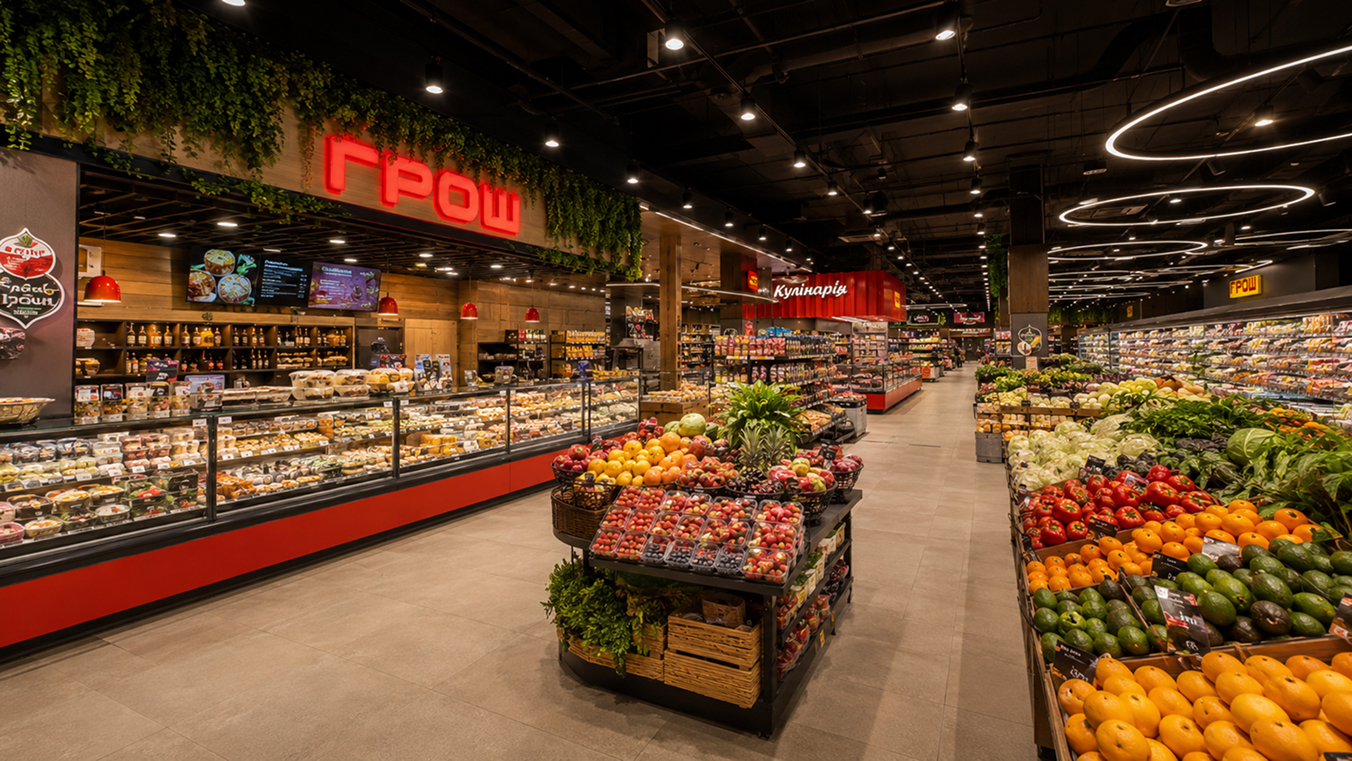
Grosh is one of the leading grocery retail chains in the Vinnytsia region. The company operates more than 100 stores of different formats, offers a wide range of products, and develops its own production, including cooking and bakery operations.

Every day, the chain processes a large volume of operational data from dozens of retail locations. As the number of stores, transactions, and users grew, the company needed a modern analytics system that could work with large datasets without adding pressure to the ERP system.

Difficulties

Large volumes of operational data every day.

Challenges

The need for a single corporate analytics system.

Briefly about the client

✓   100+ stores in grocery retail.
✓    One of the regional leaders
of Vinnytsia region.
✓    Wide range of products and
own production
.

What changed after the first stage
of implementation

100+

stores connected to analytics ecosystem

12

Power BI dashboards implemented

3

data sources unified into one model

900M+

rows processed during daily refresh

1.5h

to process large data tables

15+

manual Excel tasks automated

They came to us with slow ERP reporting and too much manual work

What the business felt every day

Employees waited for reports, ERP carried analytical load it was not designed for, and Excel became the place where data was cleaned, merged, checked, and prepared for final use.

Slow ERP reporting

Core reports took time to generate and delayed day-to-day work for operational teams.

Excel instead of analytics

After export, users still had to merge files, verify metrics, and prepare reports manually.

Overloaded ERP

Each analytical request added extra pressure on ABM Cloud instead of keeping ERP focused on operations.

Hard to scale

As store count and data volume grew, the reporting approach became less stable and less efficient.

900M+ rows revealed the limits of the existing setup

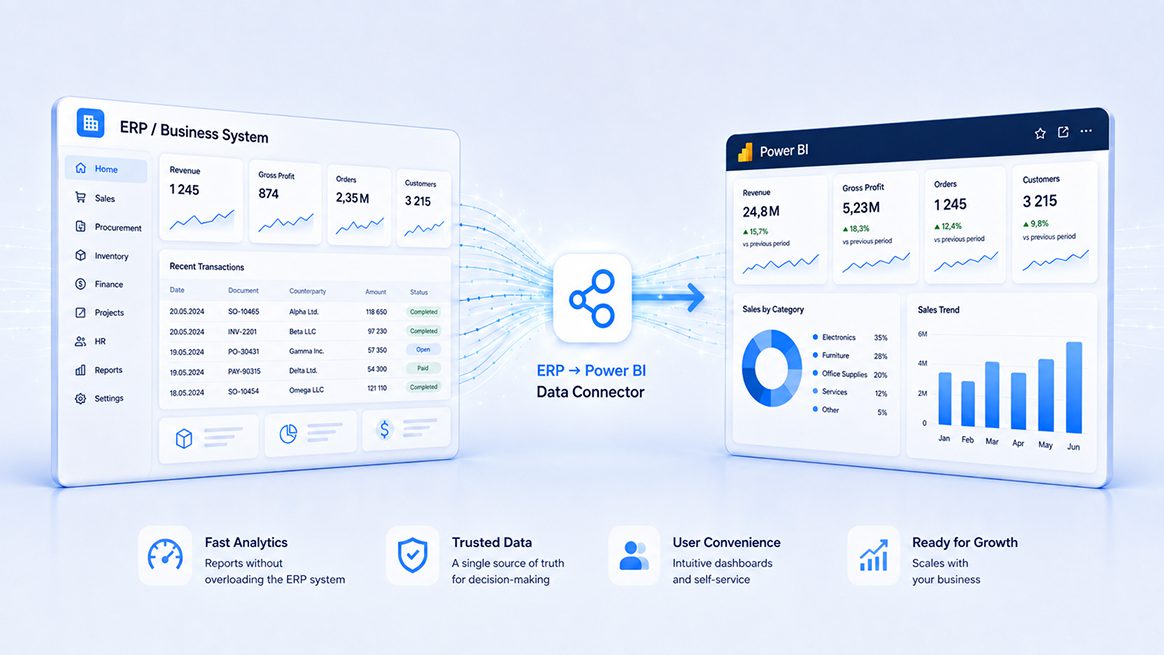
The first technical tests showed that the issue was deeper than slow reporting. ABM Cloud was hosted on a cloud server, and direct analytical workload would not deliver the required speed. Cobit Solutions separated operations from analytics: ERP remained the core business system, while Power BI worked with a prepared data layer on a faster client-side server.

ERP under reporting pressure

Users generated analytical reports directly inside ABM Cloud. This slowed down reporting and added pressure to the same system used for operational work.

Separate ETL process

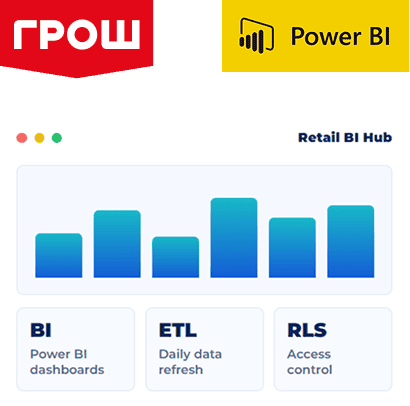
The team configured data replication from the cloud ERP to a fast server and prepared a stable layer for Power BI analytics.

Power BI without ERP overload

Dashboards started working from the prepared data environment, while ERP continued to serve as the main operational system.

12 dashboards that replaced slow
ERP reports

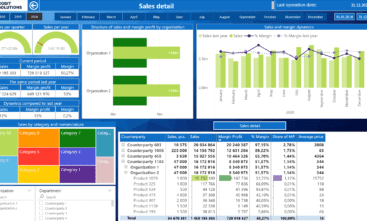
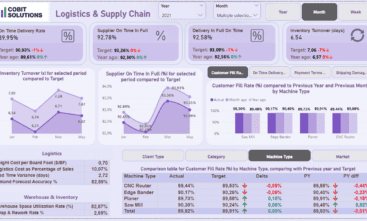
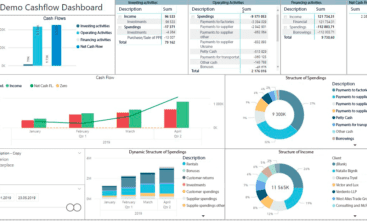
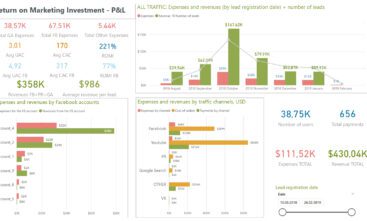
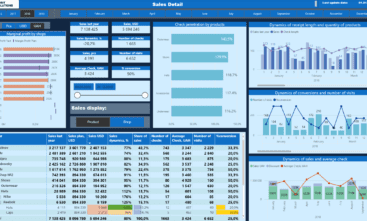
During the first stage, Cobit Solutions implemented 12 Power BI dashboards for Grosh. They helped
move key reporting from ERP into a modern BI format, reduce manual Excel work, and give users
faster access to daily analytics. Because of data confidentiality, we cannot show Grosh’s actual
dashboards. Below are examples of how similar analytics can look for your business.
Profit & Loss (P&L)

Profit & Loss (P&L)

Profit and loss statement of the company

Store Performance Dashboard

Store Performance Dashboard

Retail sales analytics - Categories, Stores, Brands, Managers

Actuals vs Budget Dashboard

Actuals vs Budget Dashboard

Revenue and budget variance insights

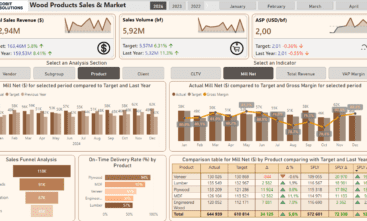
Sales & Market Analytics

Sales & Market Analytics

Products' margin structure and market

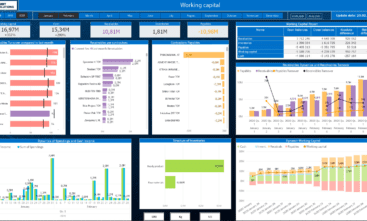
Working Capital Dashboard

Working Capital Dashboard

Cash, receivables, payables, and inventory insights

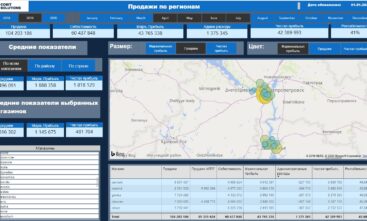
Retail dashboard

Retail dashboard

Retail efficiency GIS geo analytics

Cobit Solutions

10M+ rows per minute and a new level
of analytics

After the implementation, Grosh users received faster access to reports, while the ERP system was
no longer used as the main layer for analytical workload. Power BI became the company’s first BI platform
and the foundation for further analytics development.

Faster work with reports

____

Users no longer waited for ERP to generate heavy reports.

Less load on ERP

____

Analytics was moved to a separate BI loop.

12 Power BI dashboards

____

Key reports of the first stage were transferred to a modern format.

A single data model

____

ABM Cloud, OpenStore and Excel were combined into one analytical system.

Less manual work

____

Part of the operations after exporting to Excel were automated in Power BI.

Readiness for scaling

____

The architecture allowed BI growth without direct ERP load.

Why organizations are choosing our
Power BI implementation services

Our Power BI development work is based on solutions that directly improve decision-making quality. We help organizations structure data, connect key sources, and deliver Power BI development services that provide a clear view of performance metrics. Our team turns reporting into a practical management instrument that supports confident decisions and sustainable business growth.

image

Quick start and first results in just 1 week

image

25+ BI and Finance experts without hiring pain

image

Proven BI delivery for 8 years in 22 industries

image

More than 70 happy clients across 5 countries

image

Save 35% compared to W-2 payroll or contractors

image

Full end-to-end delivery, from reporting to support

Need expert Power BI support for your project? Hire Power BI developers and get tailored BI solutions
built for clarity, control, and measurable results.

Discuss a Similar Project

We also offer you to familiarize yourself with our other projects

Cobit Solutions Cobit Solutions