
DOWNLOAD FREE CHECKLIST
of 25 recommendations for successful BI implementation


How long does it take to develop one? What is the process like? What are the stages of a BI system implementation?
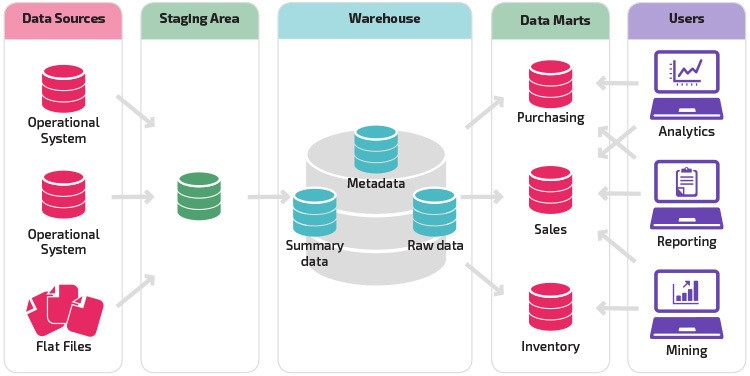
First of all, you should understand that the elegant data account for 20% of the volume of work. This is only the tip of the iceberg.
Let’s get an understanding of the process of turning Excel tables into comprehensible and appealing dashboards that contain the data on your business or subdivision.
of 25 recommendations for successful BI implementation
We commit to deliver a comprehensive, turnkey BI & DWH solution within 4 months


22 Jan 2022
A BI System ≠ IT: Why is it so?The development of interactive dashboards is sometimes viewed as a purely IT product. This is a misconception. When developing a BI system f ...
Read More
21 Nov 2023
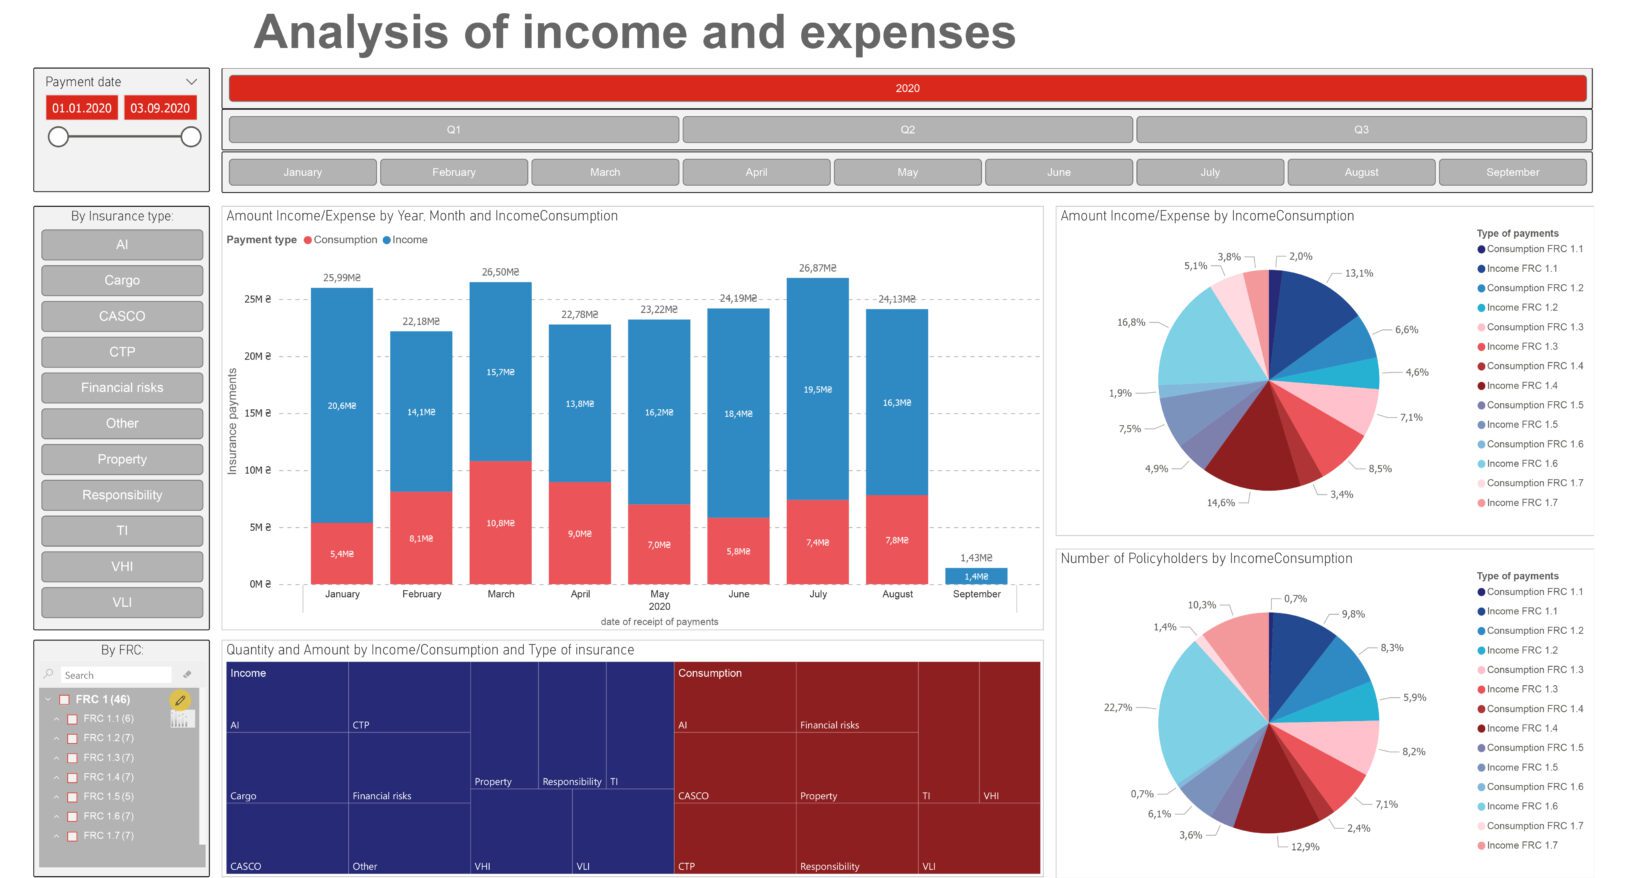
Business Intelligence for Insurance Report & DashboardsFind out the business intelligence advantages in insurance for successful management of any size businesses up to widely developed ones. ...
Read More
22 Jan 2022
Logistics Intelligence: How to Find a Parcel?One of the clients receives tens of thousands of parcels per month. Some of them get stuck regularly. It is practically impossible to manual ...
Read More457
dashboards created in 2025150+
years of IT experience among employees22
data experts & BI consultants12B
USD annual revenue of clients that utilize our analytics solutions