“Without data, you’re just another person with an opinion,”
W. Edwards Deming.

Imagine a world where every business decision is backed by clarity and confidence, where guessing gives way to precision, and where opportunities are uncovered before they’re even visible to competitors. This isn’t just the future—it’s the reality for organizations leveraging the power of business intelligence tools like Power BI. By bridging the gap between complex data and actionable insights, businesses are rewriting the rules of efficiency, innovation, and growth.
Data is no longer just a byproduct of operations; it’s the backbone of decision-making and innovation. From streamlining supply chains to enhancing patient care, businesses across industries are discovering that tools like Power BI can turn raw data into a goldmine of actionable insights. Whether it’s optimizing logistics, advancing healthcare, or transforming manufacturing processes, having access to precise and timely data has become the key to staying competitive and thriving in any market.
What Is Power BI and Why Does It Matter?
Power BI is a leading business intelligence tool developed by Microsoft that helps organizations transform raw data into meaningful, actionable insights. With its ability to integrate seamlessly with various data sources—ranging from Excel spreadsheets to complex databases—Power BI provides a unified view of an organization’s operations. Its intuitive interface allows users of all skill levels to create dynamic dashboards, generate real-time reports, and uncover trends that drive smarter decision-making.
🎯 Marketing Analytics with Power BI
Client: Heineken
Industry: FMCG
Challenge: Limited visibility into campaign effectiveness hindered ROI optimization.
Solution: Power BI enabled dynamic campaign performance tracking and better resource allocation.
- 20% increase in sales.
- 10% decrease in marketing expenses.
Interesting Fact 💡
Every $1 invested in Power BI-driven analytics generated $5 in additional revenue for Heineken
🚚 Supply Chain Visibility with Power BI
Client: Toyota
Industry: Automotive
Challenge: Lack of visibility in global supply chain operations.
Solution: Power BI dashboards enabled Toyota to track shipment statuses, vendor performance, and inventory levels.
Results:
- Reduced supply chain delays by 15%.
- Improved on-time delivery metrics.
🏥 Healthcare with Power BI
Client: Dobrobut ClinicsIndustry: Healthcare
Challenge: Tracking performance metrics and managing costs across an expanding network of clinics.
Solution: Power BI dashboards allowed real-time tracking of utility expenses, customer feedback, and P&L reports.
Results:
- Data availability increased by 30x.
- Saved 80% of time spent on analytics.
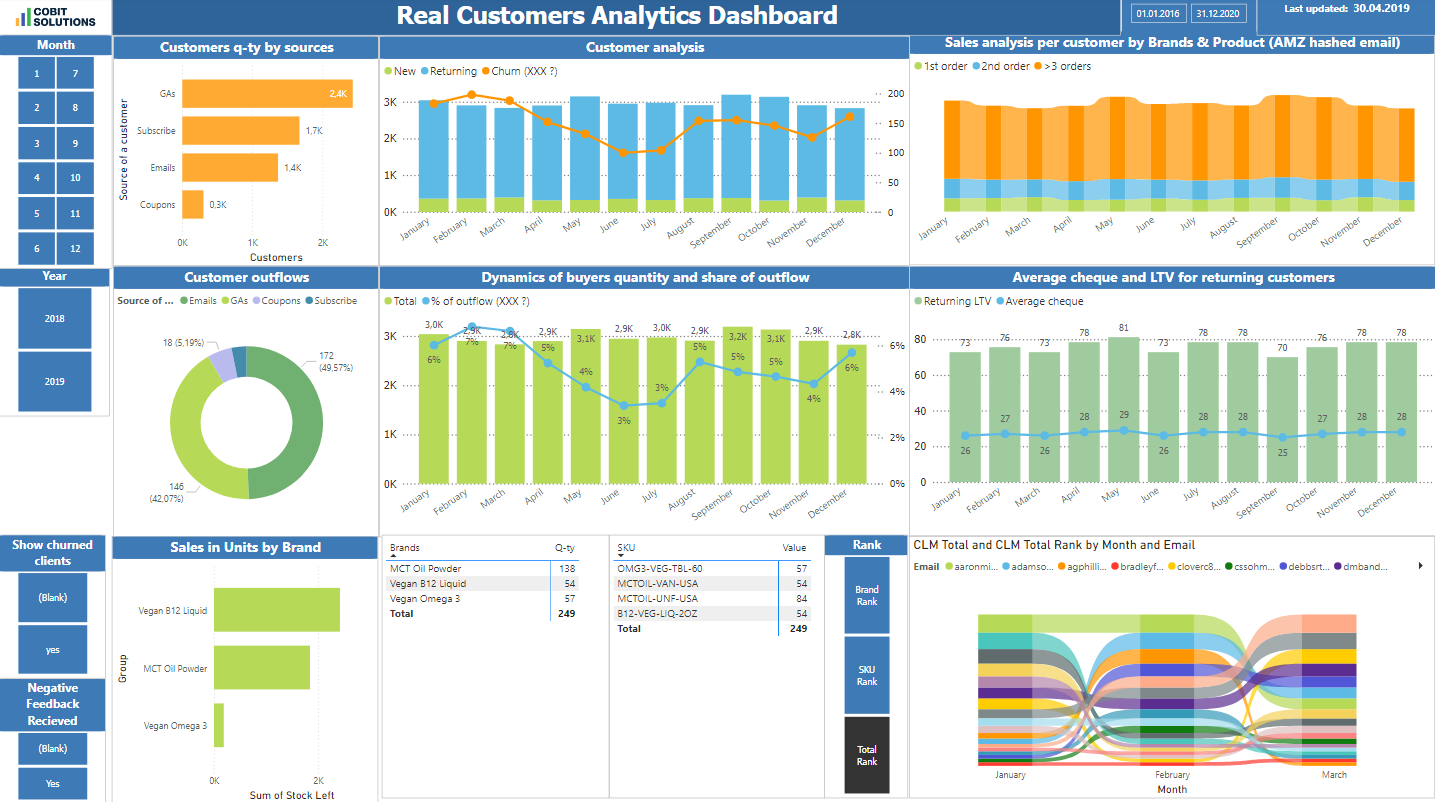
Want to learn more about this case? Read our article.
✈️ Aviation with Power BI
Client: Delta Airlines
Industry: Aviation
Challenge: Limited tools for real-time passenger feedback analysis.
Solution: Power BI dashboards provided insights into customer behavior and operational efficiency.
Results:
- 15% faster turnaround times for flight operations.
- Boosted customer satisfaction scores by 12%.
📦 Power BI in the Logistics Industry
Client: FM Logistics
Industry: Logistics
Challenge: Managing multi-regional operations led to data silos and slow decision-making.
Solution: Power BI and Azure were implemented, integrating financial and operational data for real-time analysis.
Results:
- 80% faster data consolidation.
- 15% cost reduction in operations.
Insight 💡
FM Logistics saved the equivalent of 10 full-time employees’ workload annually through automation.
🌾 Power BI for Agricultural Industry
Client: Agropartner
Industry: Agriculture
Challenge: Spreadsheets couldn’t handle growing data complexity.
Solution: Integrated ERP data and CRM into Power BI dashboards.
Results:
- 40% faster reporting cycles.
- Reduced agricultural wastage by 25% during peak seasons.
🔬 Healthcare Equipment with Power BI
Client: Medtronic
Industry: Medical Devices
Challenge: Inefficient equipment usage and supply chain forecasting.
Solution: Power BI dashboards provided precise usage trends and demand forecasting.
Results:
- 10% reduction in equipment downtime.
- Optimized replenishment cycles.
Did You Know? The Data Revolution Is Here
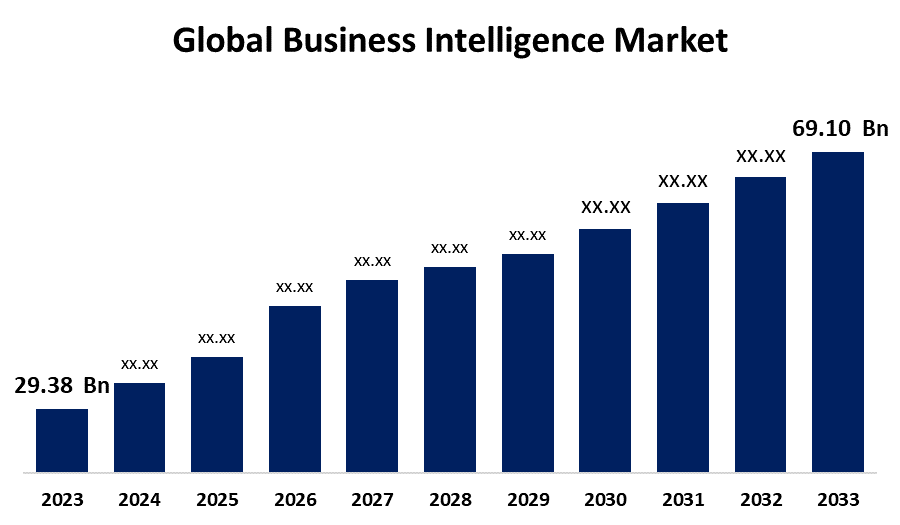
👉 By 2026, the global business intelligence market is expected to exceed $50 billion, growing at a CAGR of 12%.
👉 Companies using advanced analytics tools see a 6% higher annual revenue growth compared to those that don’t.
📋 Project Analytics Using Power BI
Client: Alpha Serve
Industry: Software
Challenge: Providing clients with advanced analytics tools without requiring deep technical expertise.
Solution: Power BI dashboards for tracking costs, team productivity, and project KPIs.
Results:
- Increased client base.
- Streamlined operational reporting.

The developed perfectly looking Bl templates allow our clients to quickly build their first report in Power Bl and include the most relevant KPIs for reports. – Anna Odrynska, CSO at Alpha Serve

⚙️ Manufacturing Line with Power BI
Client: PepsiCo
Industry: Manufacturing
Challenge: Identifying bottlenecks in production lines.
Solution: Power BI dashboards automated supply chain monitoring and production analytics.
Results:
- 12% reduction in production downtime.
💊 Pharmacy Inventory Management with Power BI
Client: Podorozhnyk
Industry: Retail Pharmacy
Challenge: Slow, manual inventory processes across 2,000+ pharmacies.
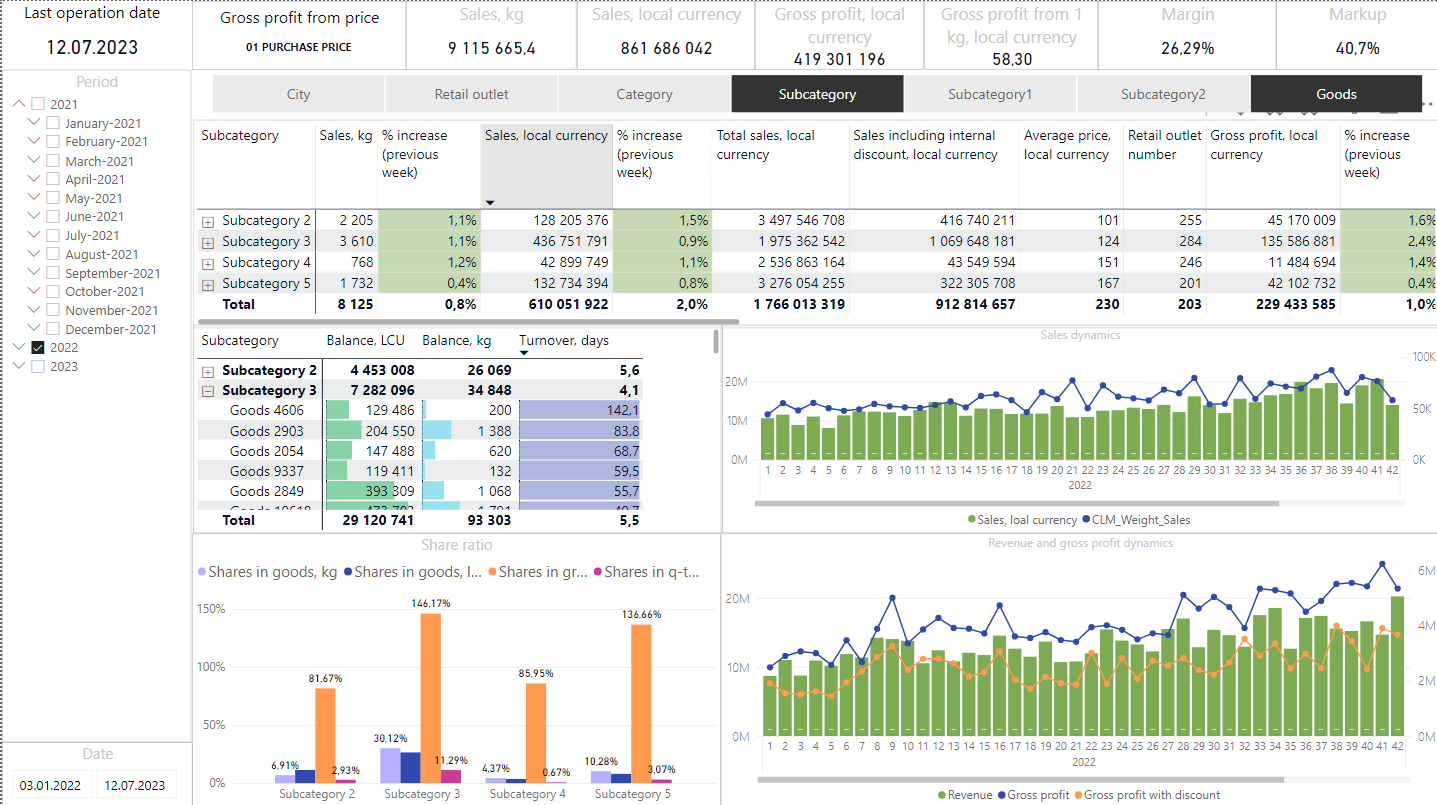
Solution: Power BI and Azure Cloud enabled automated inventory management.
Results:
- Report preparation reduced from 5 hours to 4 minutes.
- Excess stock decreased by 1%, freeing millions in working capital.
✈️ Travel Experiences in Aviation with Power BI
Client: Virgin Atlantic
Industry: Aviation
Solution: Power BI analyzed passenger behaviors, enabling tailored travel experiences.
Results:
- Higher customer loyalty.
- Increased repeat bookings.
🌍 Nonprofit Aid Programs with Power BI
Client: UNICEF
Industry: Nonprofit
Solution: Power BI enhanced reporting on aid program effectiveness and donor impact.
Results:
- Greater donor engagement.
- Improved allocation of resources.
🚚 Logistics with Power BI
Client: Silk Road Logistics
Industry: Logistics
Challenge: Siloed data and inefficiencies in railcar turnover.
Solution: Power BI dashboards monitored operational flows and financial planning.
Results:
- Reduced railcar downtime.
- Improved financial transparency.
Want to learn more about this case? Read our article.
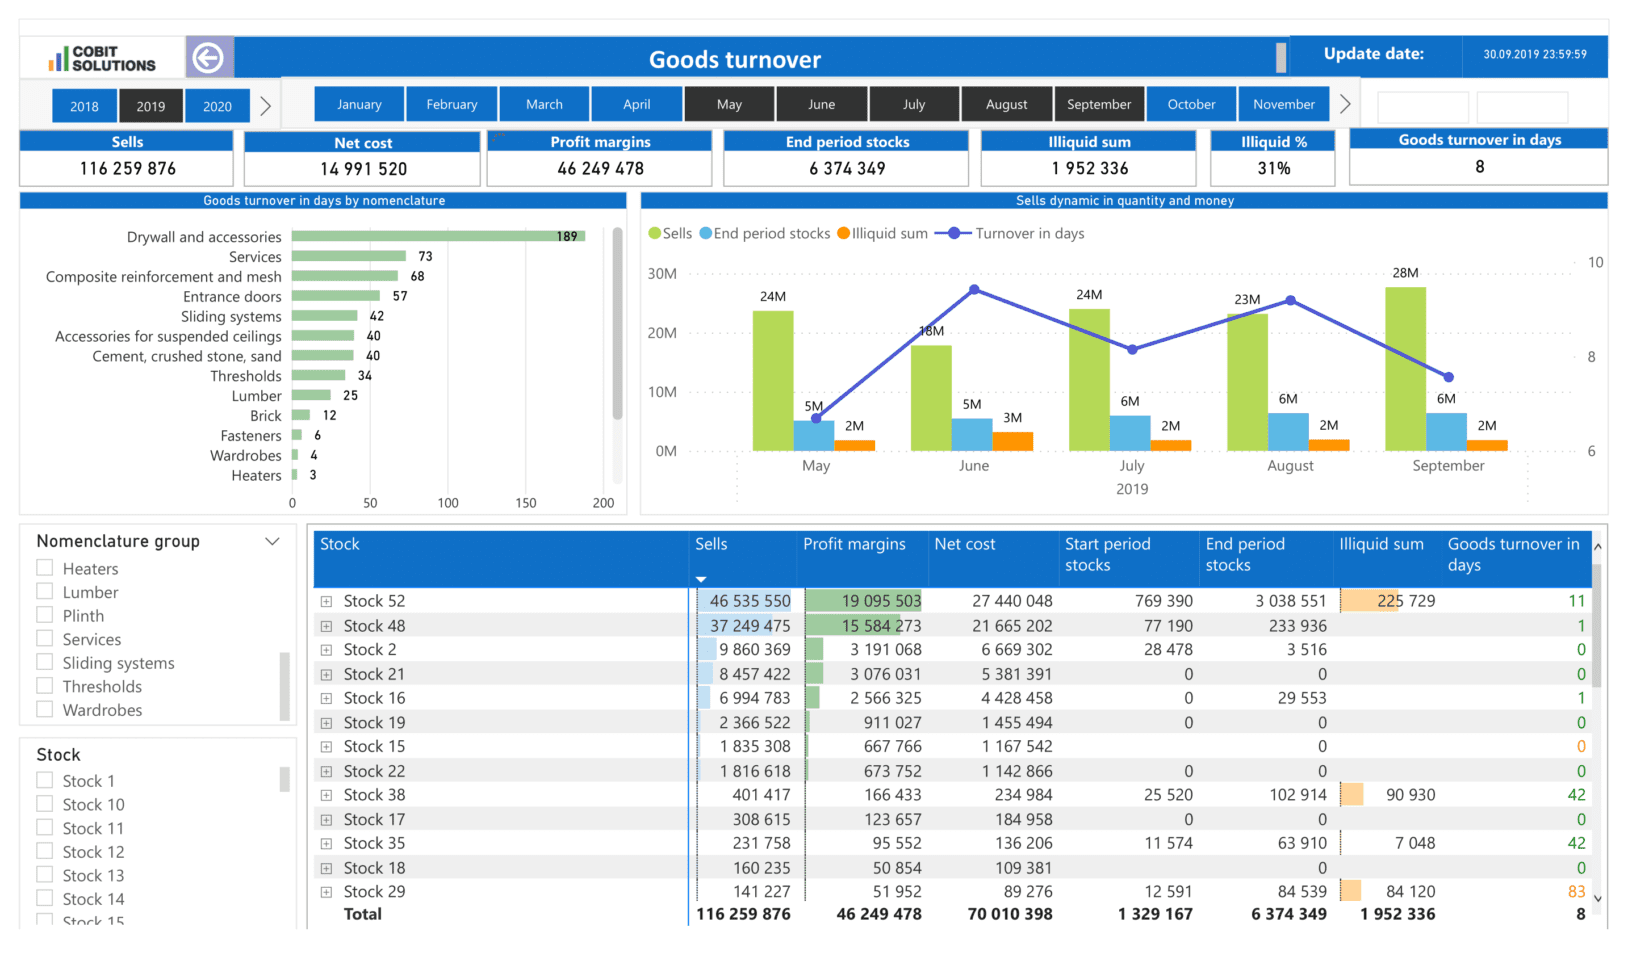
🔋 Energy Analytics with Power BI
Client: Energo Leader
Industry: Energy
Challenge: Delayed reporting on energy production costs and emissions.
Solution: Power BI dashboards offered real-time cost reporting and sustainability metrics.
Results:
- Real-time cost reporting (previously took two months).
- Improved emission tracking for regulatory compliance.
👥 Global Teams Using Power BI
Client: Jacobs Engineering
Industry: Professional Services
Challenge: Managing global project data across diverse teams.
Solution: Power BI enabled seamless integration of project KPIs and financial metrics.
Results:
- Improved resource allocation.
- Reduced project overruns by 10%.
Power BI as the Future of Data-Driven Success

Power BI isn’t just a tool — it’s a transformative force. From logistics to healthcare, agriculture to aviation, these case studies prove how business intelligence and data analytics can drive growth, reduce costs, and enhance decision-making.
Whether it’s a global leader like Heineken boosting sales or a healthcare provider like Dobrobut saving 80% of reporting time, Power BI empowers organizations to thrive in a world where data analytics is the new currency.
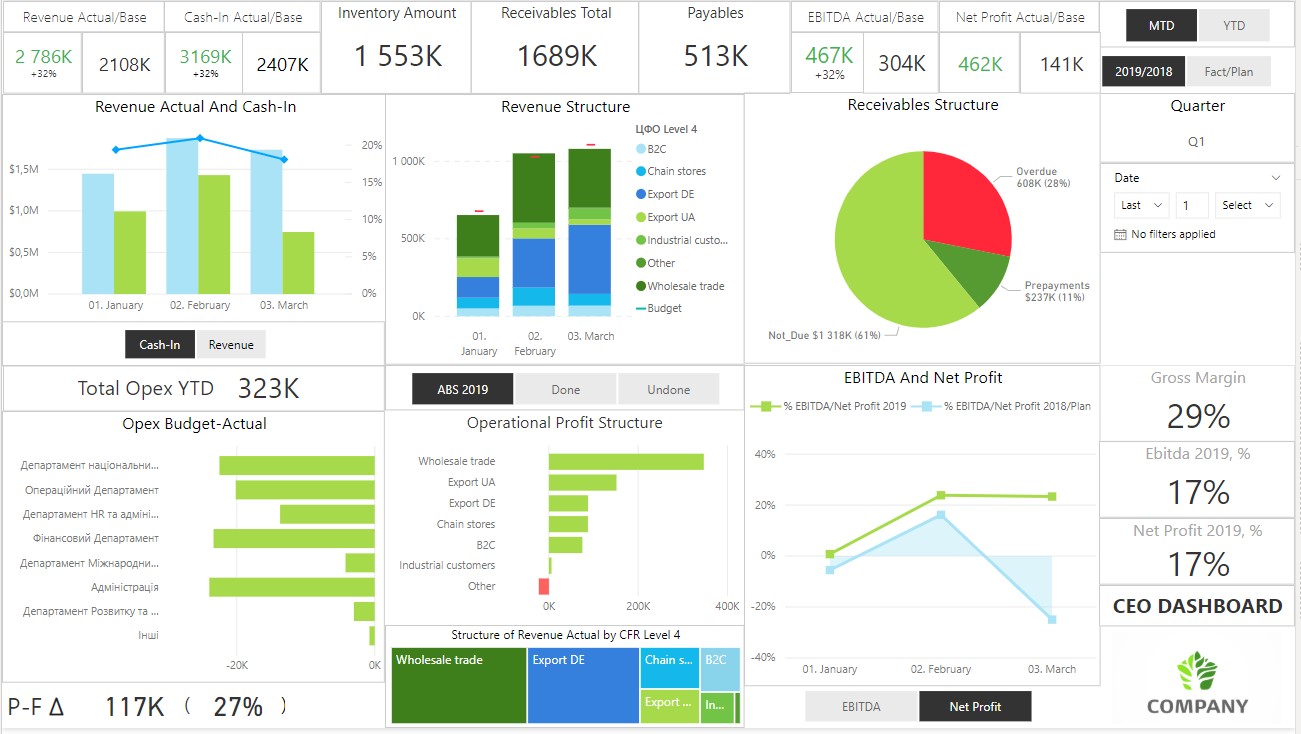
Why Choose Cobit Solutions?
Tailored Solutions
Every Power BI dashboard we create is custom-built to match your specific goals. From advanced ETL pipelines to real-time visualizations, we adapt to your needs, ensuring your data serves your strategy.
Affordable Excellence
- Save up to 25% compared to in-house teams or traditional contractors.
- Hire Power BI experts starting at $40/hour without compromising on quality.
- Scale up or down effortlessly—pay only for the expertise you need.
Proven Results Across 22 Industries
With a portfolio spanning industries like healthcare, logistics, and finance, Cobit Solutions has a track record of delivering measurable impact.
Imagine Your Success Story
Every business has untapped potential. What if your team could uncover inefficiencies, predict trends, and make faster decisions—just like these companies did? With Power BI and Cobit Solutions, you can turn your challenges into opportunities.
Visit Cobit Solutions Consulting Services today to schedule a consultation and take the first step toward transforming your business.
Your data has the answers—let’s unlock them together.
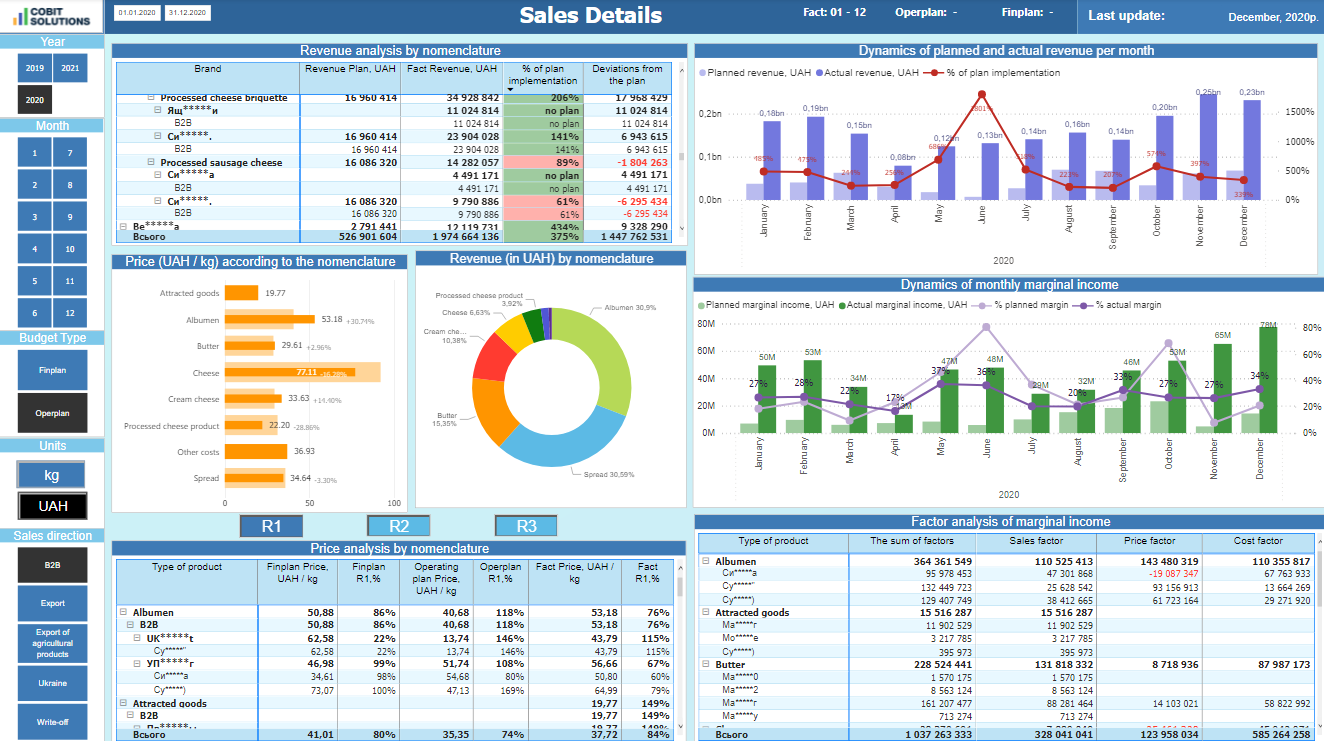
Developing the business becomes more comfortable when you regulate the workflows according to the fast reports with interactive analytics.
Dashboards creation

You might also be interested in the article by the owner of Cobit Solutions Why does my company need business intelligence?
Read more on real cases of BI system implementation in different industries on our Blog.


