Power BI’s Impact on IT Service Management

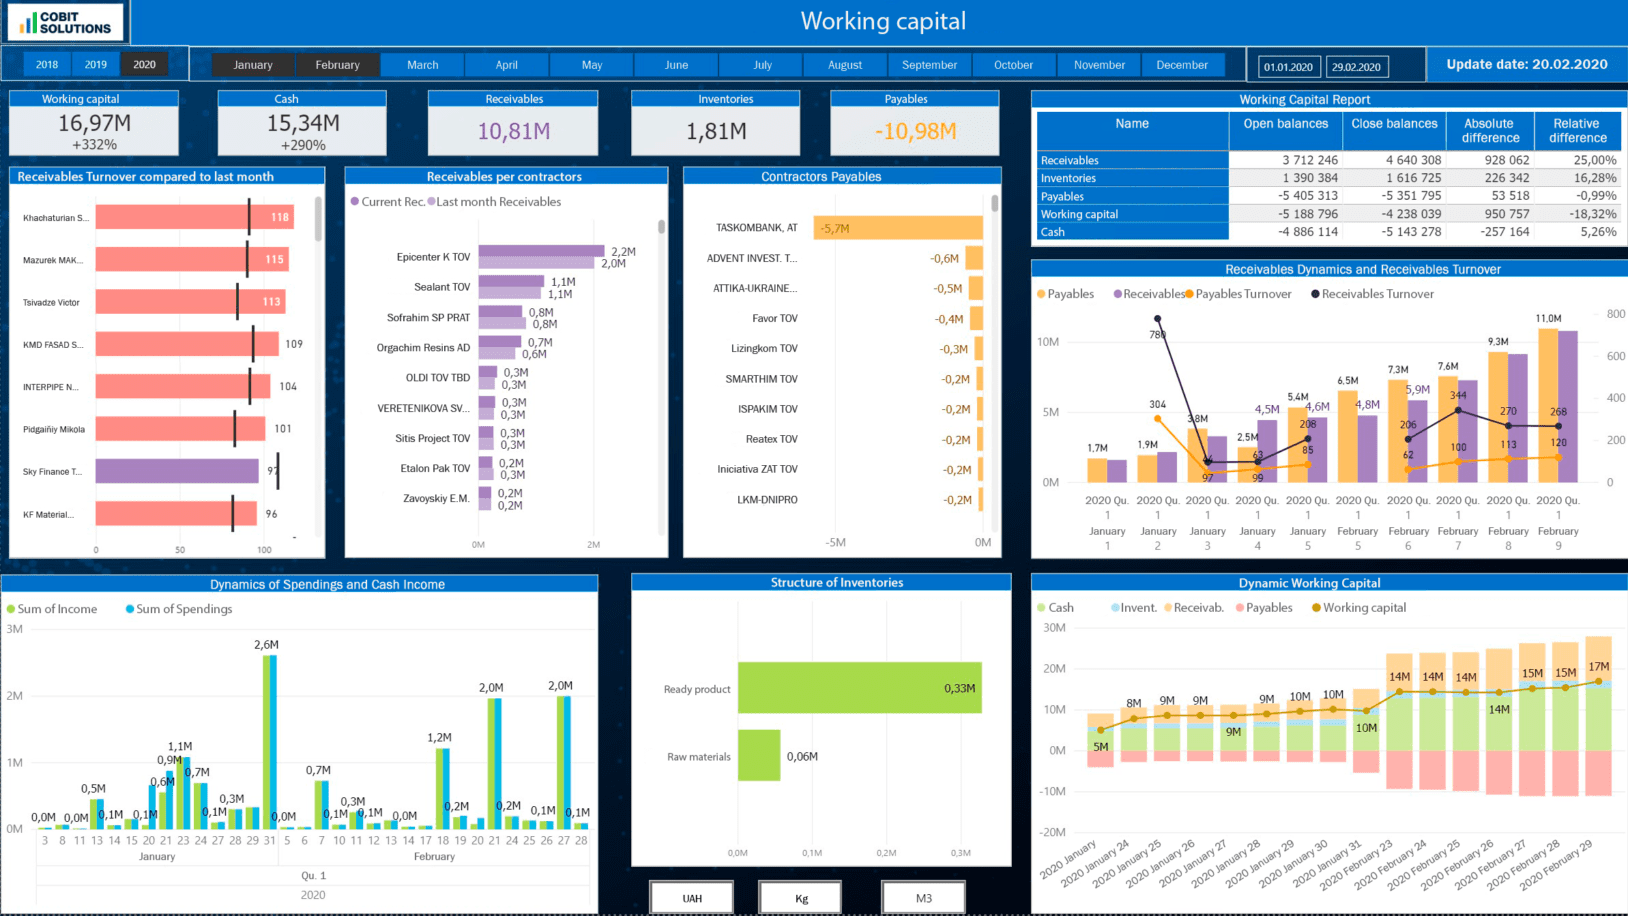
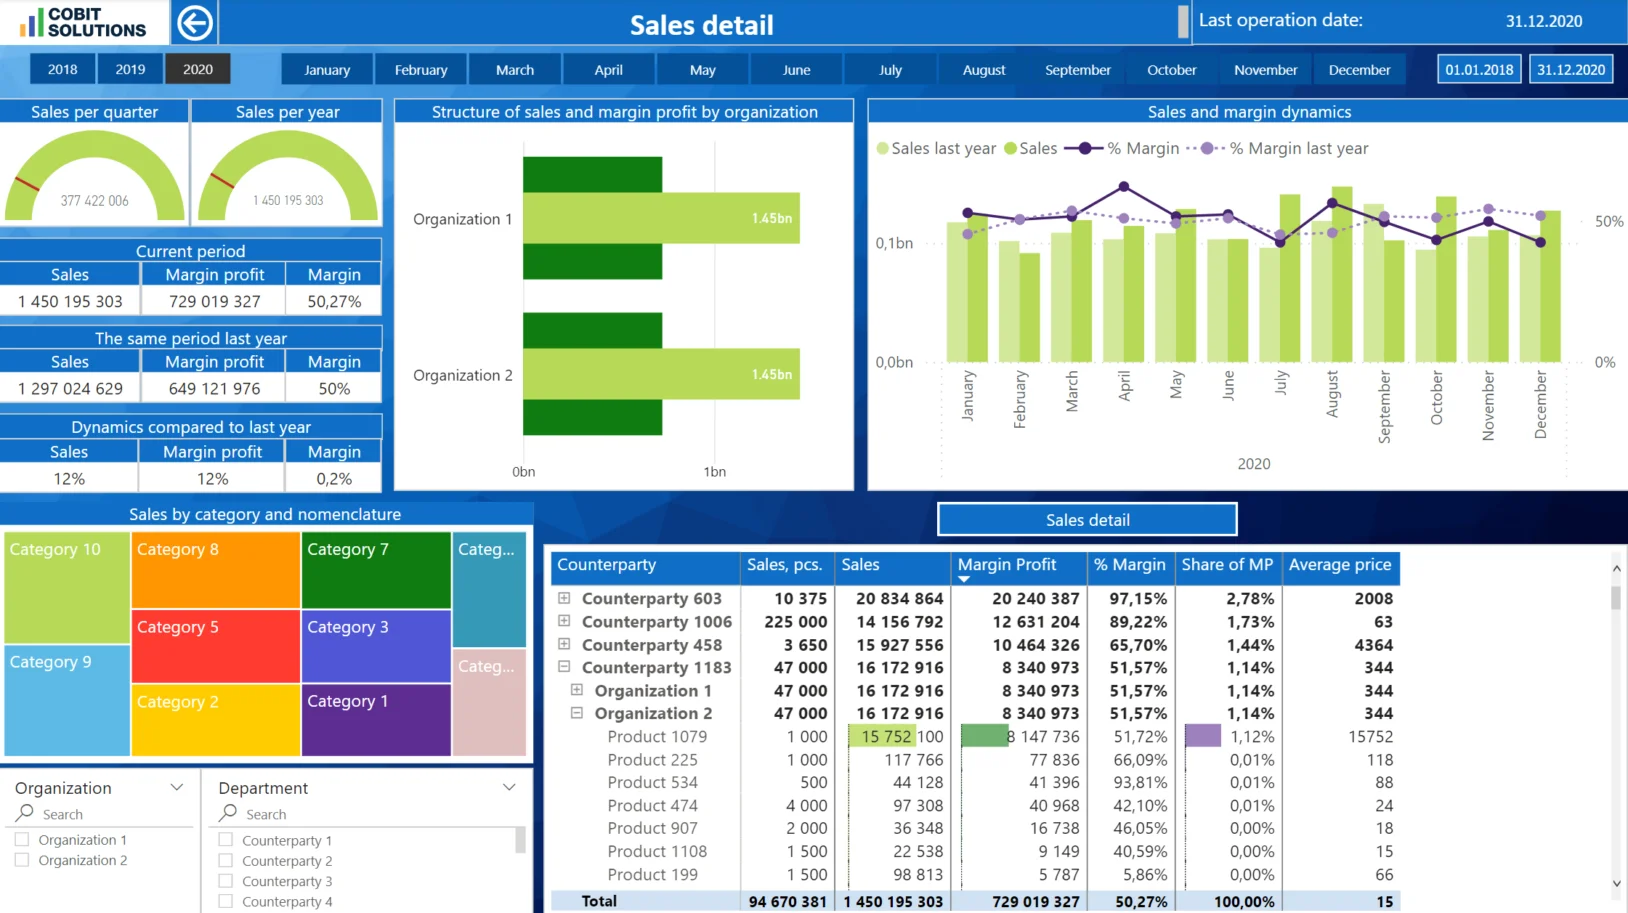
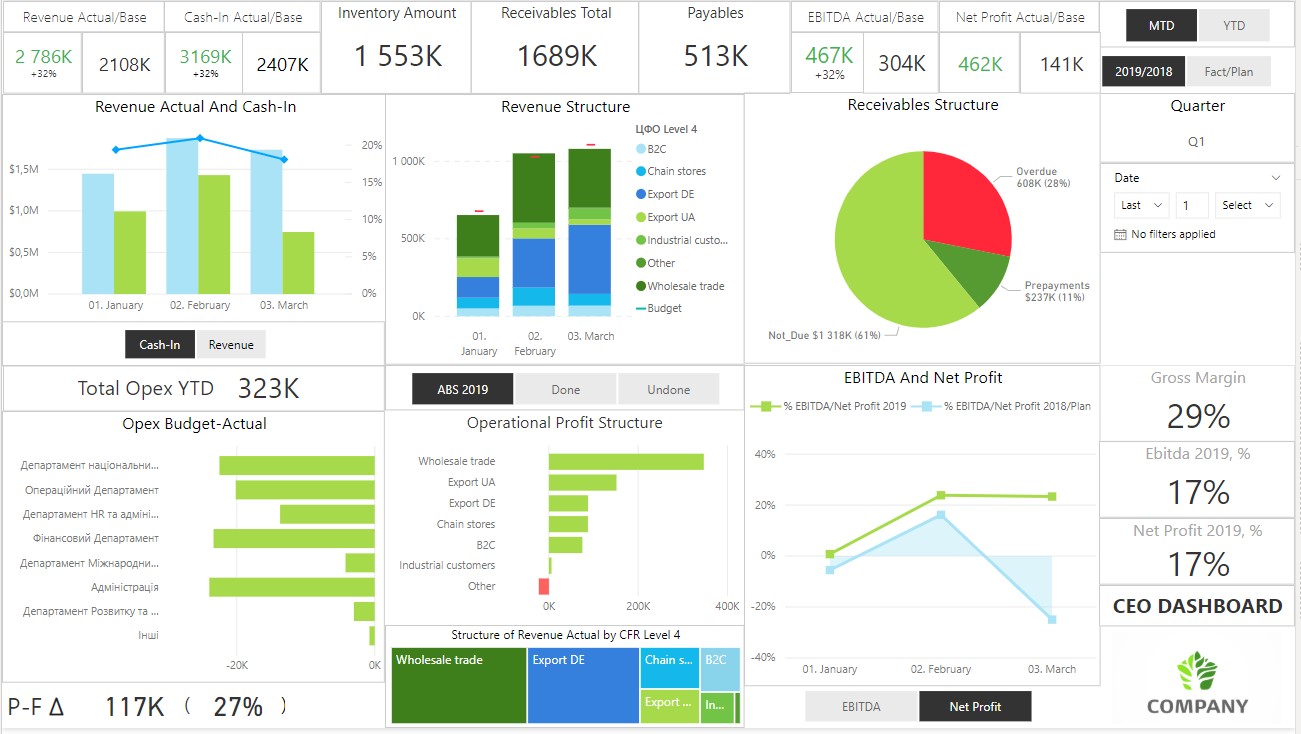
The developed perfectly looking Bl templates allow our clients to quickly build their first report in Power Bl and include the most relevant KPIs for reports.

Industry Overview: Growing Demands in IT and Business Services
Streamlining IT Operations: Solutions Implemented with Power BI
The primary challenge was to create preconfigured Power BI dashboards tailored for Jira, enabling users to interact with data for analytical reporting, KPIs, and other essential metrics without requiring code. Clients wanted an easy-to-use solution for Power BI analytics.
Cobit Solutions collaborated on a three-year project to design Power BI for Jira, including:
- Jira Cost Tracker Report
- Jira Project Dashboard
- Jira Timework Report
- Jira IT Service Management Solutions Dashboard
These templates boosted operational efficiency, labor productivity, and Power BI project management capabilities.
Long-Term Benefits of Power BI for IT Services

1. Increased Revenue: Through the insightful analysis provided by the Power BI dashboards, Alpha Serve could identify inefficiencies in project costs, timelines, and resource allocation. This led to better pricing strategies and improved profit margins.
2. Client Growth: The clarity and depth of insights offered by the dashboards not only deepened relationships with existing clients but also attracted new ones seeking similar analytical capabilities. This transparency in project management became a key selling point.
3. Distinctive Market Position: By integrating advanced analytics into their offerings, Alpha Serve set themselves apart in a competitive landscape, showcasing their dedication to leveraging technology for enhanced business intelligence.
4. Enhanced Efficiency: Automating the process of data analysis and reporting with these dashboards significantly reduced the manual effort required, allowing the team to focus more on strategic activities and client interaction, which in turn facilitated company growth.
Feedback and Results
Cobit Solutions Power BI templates are highly adaptable and designed for seamless, code-free integration, ensuring straightforward report generation for users.


Get in Touch with Us
To order Power BI dashboards you can fill the form on our website and client managers will connect with you for the details.
After the project starts you may get the first result over 1-1,5 months. Business intelligence in manufacturing is comfortable for usage as you can see interactive reports any time and time saving for the vital decisions of directors and other decision makers.
Dashboards don’t demand time for calculation because they show the analytical reports refreshed and ready. Just use the data when you need your Key Performance Indicators for effective management of the business
Management reports are easy to understand because they are tailored to clients’ needs and design. Each of the department heads will get the necessary data for work and vital KPIs for the company’s success.
Developing the business becomes more comfortable when you regulate the workflows according to the fast reports with interactive analytics.
Dashboards creation

You might also be interested in the article by the owner of Cobit Solutions Why does my company need business intelligence?
Read more on real cases of BI system implementation in different industries on our Blog


