
DOWNLOAD FREE CHECKLIST
of 25 recommendations for successful BI implementation


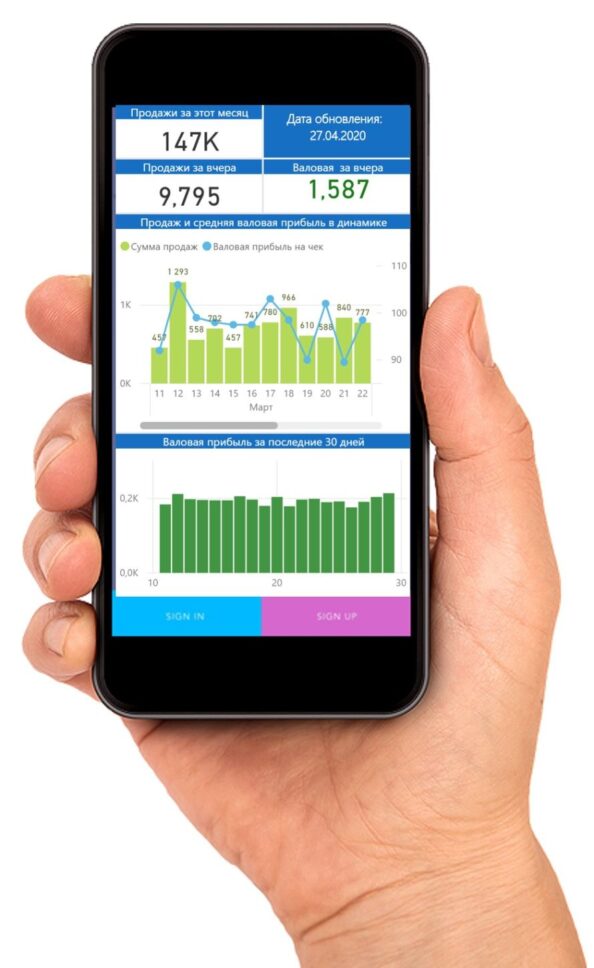
The development of interactive dashboards is sometimes viewed as a purely IT product.
This is a misconception.
When developing a BI system for a specific business, in addition to the IT you must also be competent in finances, sales, marketing, while understand the business processes and the industry’s specificities.
of 25 recommendations for successful BI implementation
We commit to deliver a comprehensive, turnkey BI & DWH solution within 4 months


14 Sep 2024
Real Time Manufacturing Analytics: Insights & SolutionsLearn how Power BI manages real-time data with dynamic dashboards and actionable insights ...
Read More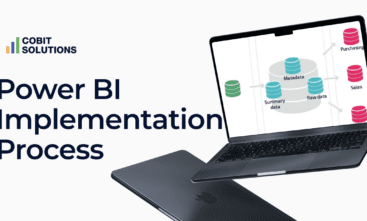
22 Jan 2022
Power BI Implementation ProcessHow long does it take to develop one? What is the process like? What are the stages of a BI system implementation? First of all, you should ...
Read More
09 Mar 2022
Case study. Find a BI solution for a Fashion Retail companyThe purpose of implementing Power BI in retail: Fix the malfunctions in the current analytics software. Refine the existing add-on that ext ...
Read More457
dashboards created in 2025150+
years of IT experience among employees22
data experts & BI consultants12B
USD annual revenue of clients that utilize our analytics solutions