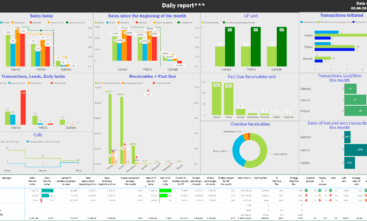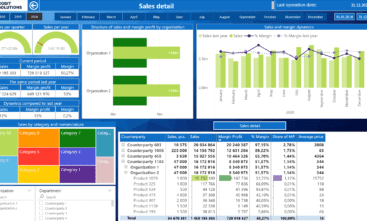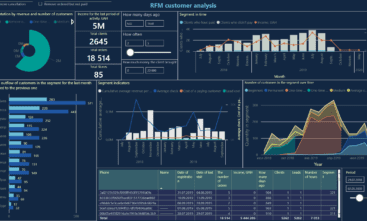
Manufacturing businesses have a huge number of workflow metrics which can show the results of business and what is happening. How to make these vital numbers work for growth? The answer is to set ambitious and actionable goals. Goals will be your roadmap through time.
But what to manage if you don’t understand where you are now? The most demanding analytical dashboards for manufacturing company can track the real state and goals achievement. Modern leading tool for the game players is manufacturing Power BI dashboard with its many functions of real-time insights and processes optimization to help with vital business decisions.
What does the manufacturing analytics dashboard show and what is it for?
Manufacturing analytics dashboard is a general type of dashboards however it can different for each industry plus the type of analysis you need.
In manufacturing companies, an important issue is effective inventory planning to maximize Service Level to customers and minimize illiquid inventories.
The main tool for effective planning is the preparation and visualization of MPS (Master Production Scheduling) based on the sales forecast. This plan reflects the provision of the necessary products to the forecast sales volume and the formation of a sufficient balance in the warehouse to ensure a high Service Level.
Later on its basis, MRP (Material Requirement Planning) is formed to plan the supply of necessary raw materials. It shows what raw materials and goods need to be purchased, in what quantity, when and how. If a company has its own distribution network, it is also important to draw up and analyze DRP (Distribution Requirement Planning) plans, which help determine what supplies in what quantity at which location and when are required. Monitoring these plans, the system allows to effectively manage the company’s inventory and provide customers with a high Service Level.
It gives you a concise view of results-based reports. Main breakdowns for the manufacturing dashboard could be:
- dynamics
- organizations
- projects
- lines of business
- departments
- warehouses
- product groups
- SKU
- of vendors / clients
- order statuses
- services
- managers
General types of analyzes are not just the fact, but comparison of fact and last year, fact and plan, fact and last month, fact and deviations.
See more digital marketing dashboard examples to suit your needs and identify spend on and top/bottom performing products across each marketing funnel.
What are the target roles and dashboard users?

Manufacturing dashboard software is perfectly serving decision makers and key persons standing on the guard of financial control. Its target roles and users positions in the organization are:
- CFO
- SEO
- financiers
- paymaster
- head of sales
- board members
Cobit Solutions' Clutch Review:
What is a Manufacturing Dashboard?
Manufacturing analytics dashboard is a general type of dashboards however it can different for each industry plus the type of analysis you need.
In manufacturing companies, an important issue is effective inventory planning to maximize Service Level to customers and minimize illiquid inventories.
The metrics in manufacturing dashboard may include:
- Inventories - displays the structure of balances by main groups and SKU in money and quantity.
- Sales - shows the degree of the company's success, since it includes the amount of money received in the company's account during the reporting period from the sale of products.
- Service Level - the indicator of company work quality. Could be analyzed like the ratio of the current period indicator to the previous. By the previous day, week, month, year.
-
Inventory turnover - Inventory turnover (ratio) = Cost of sales
Average annual inventory balance. This indicator characterizes the quality of stocks and the effectiveness of their management, allowing you to identify the remains of unused, obsolete or substandard stocks. The importance of the indicator is connected with the fact that profit occurs with each "turnover" of stocks (ie, use in production, operating cycle). - Gross profit by inventory groups or SKU = Sales profit – cost of goods sold (works, services) A company's gross profit is the simplest measure of its profitability.
- CoGS = cost of goods purchased from supplier + direct costs // Cost of retailer net purchases, including any shipping + reduction in inventory OR minus increase in inventory.
Manufacturing analytics dashboard is a general type of dashboards however it can different for each industry plus the type of analysis you need.
In manufacturing companies, an important issue is effective inventory planning to maximize Service Level to customers and minimize illiquid inventories.
Manufacturing Dashboard demo
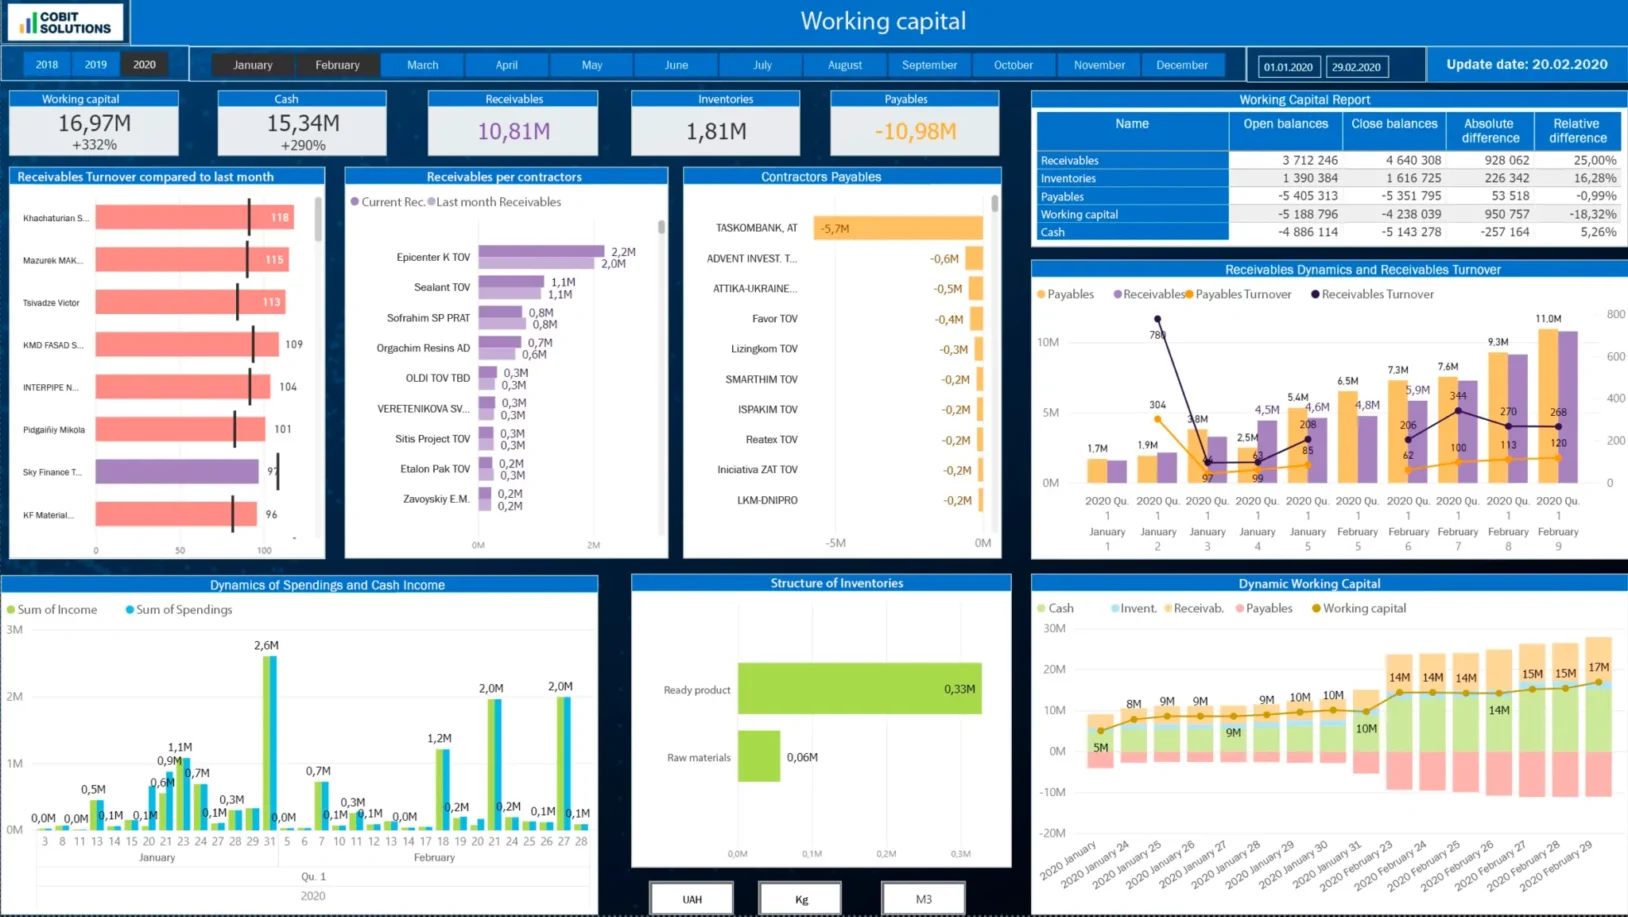
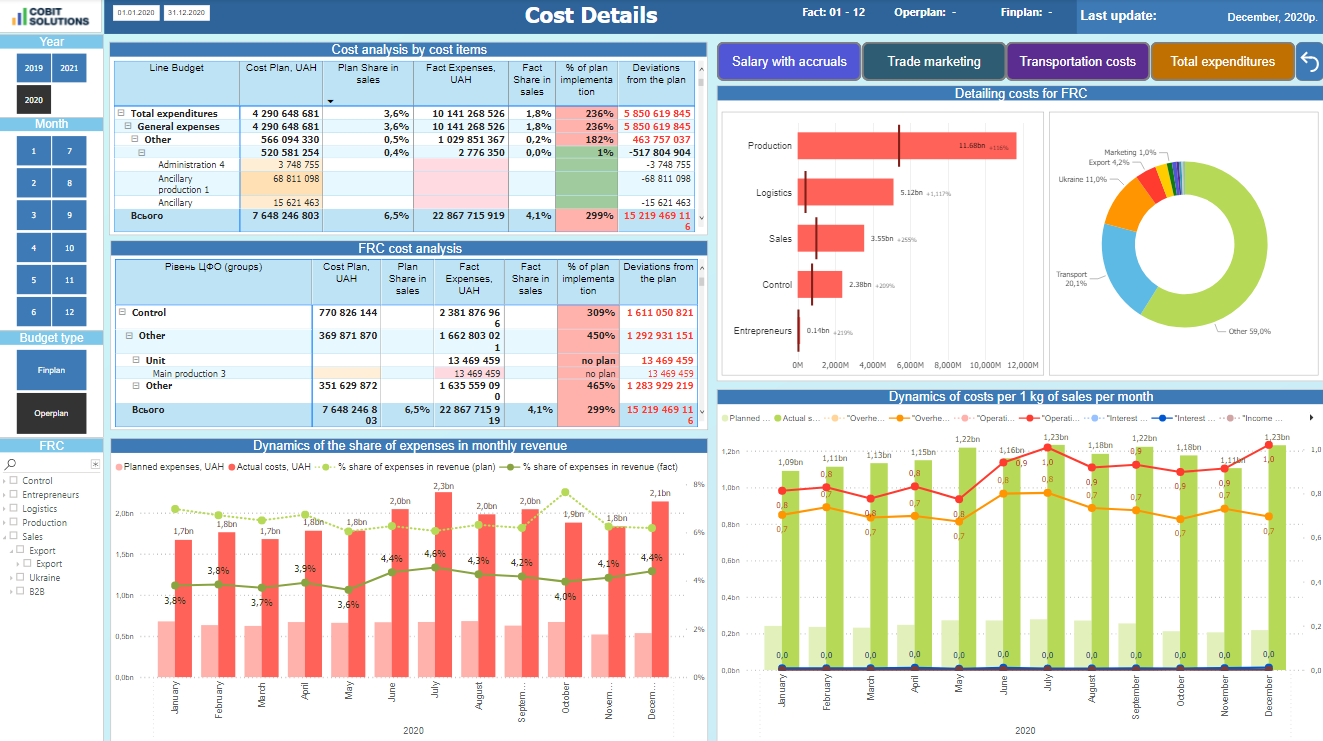
Manufacturing quality dashboard is an important one for the start of business analytics implementation, because managers are bombarded daily with issues that demand prioritization and decision making. Such adjustment tools as interactive reports give all the vital data from disparate sources, help to see the balance, weak point and forecast the situation.


Other types of Manufacturing dashboard:
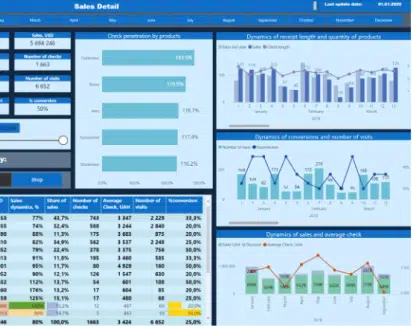
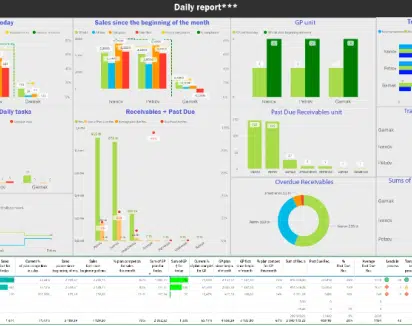
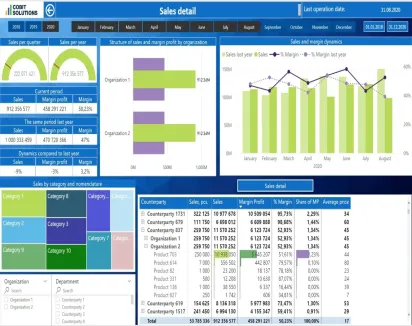
Manufacturing DASHBOARD VARIATIONS
Our Power BI consultants will develop tailor made dashboards that will help effectively control sales
OUR Power BI consultancy benefits
- Leveraging best practices:
- Saving your time and money
- Power BI and data technology experts implementing turn-key data solutions
- Delivering customized dashboards crafted for your organization's needs
- 20-30% less expensive than hiring a local FTE.
- Read more about BI consulting and advisory
- You might also be interested how to improve overall performance in manufacturing industry

Power BI, ETL, DWH Development:
![stars [:en]stars[:]](https://cobit-solutions.com/en/wp-content/uploads/sites/2/elementor/thumbs/stars-qgeqdxws1hhfn9upqdtmmw31jxbq3judwkbn7z9ec0.gif)
Turn-key BI implementation services:
ETL Data
Integration
Get the turnkey ETL data integration services for ERP, API, CRM, DB, Excel and any other IPs
BI Dashboard
Development
Build custom dashboards tailored to business needs, including front-end interfaces and core back-end technologies
Platform and
Infrastructure
Transforming your data silos into high-end decision-making tools on the Power BI platform for daily updated reports.
AI/ML and
Data Science
Implementing AI/ML and data science options into interactive analytics solutions that help organizations increase revenue and margins
What's Your Stack?
