With its intuitive interface and robust analytics capabilities, Power BI empowers businesses to make informed decisions and drive growth.
In this blog post, we will explore the benefits and possibilities of integrating Power BI with JD Edwards, a leading enterprise resource planning (ERP) solution.
Table of Contents
Why integrate Power BI into JD Edwards?
The integration of JD Edwards with Power BI is an investment in long-term cost efficiency. By automating manual processes, optimizing resources, and leveraging predictive analytics, you can achieve substantial cost savings for your organization while enhancing the overall effectiveness of your operations.
By integrating JD Edwards and BI, businesses can automate the collection and analysis of data, ensuring accuracy and timeliness. This automation reduces the risk of human error and frees up valuable resources to focus on strategic tasks. Additionally, the integration supports continuous improvement by providing feedback loops that help identify inefficiencies and areas for optimisation.
Real-time access to comprehensive reports and dashboards that present complex data in a user-friendly format.
Data-driven insights facilitate informed decisions, reducing reliance on intuition and guesswork.
Ability to handle large volumes of data from diverse sources, supporting business growth and expansion.
Benefits of Power BI Integration
with JD Edwards
The integration of Power BI with JD Edwards opens up a world of possibilities for organizations seeking to leverage their data for competitive advantage. By combining the robust capabilities of Power BI with the rich functionality of JD Edwards, businesses can unlock the true power of their data, gain valuable insights, and make informed decisions.
1. Unlocking Data Visualization and Reporting Capabilities:
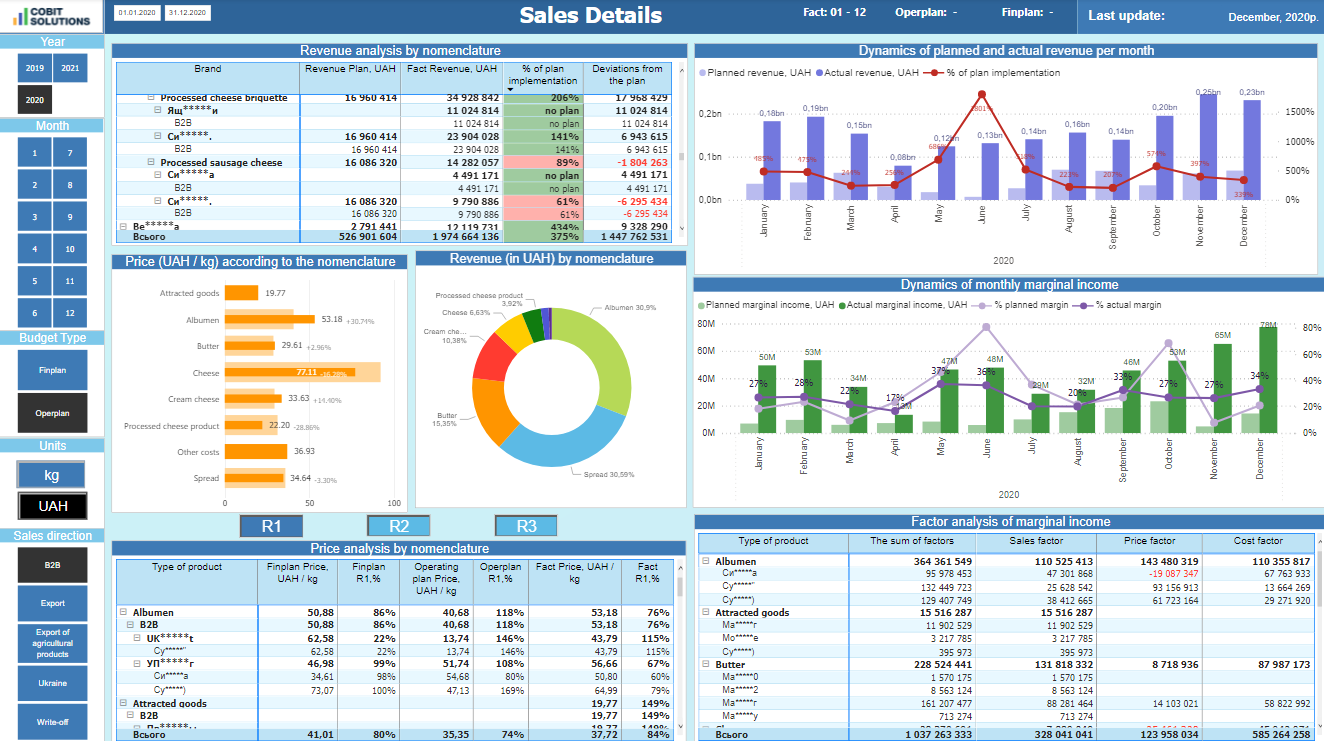
JD Edwards serves as the backbone of many organizations, handling critical business processes across finance, manufacturing, distribution, and more. By integrating JD Edwards with Power BI, you can leverage Power BI’s advanced data visualization and reporting capabilities to transform raw data into meaningful insights. Power BI’s user-friendly interface allows users to create interactive dashboards, reports, and visualizations, enabling stakeholders to gain a comprehensive view of their JD Edwards data.
2. Real-Time and Centralized Data Access:
The integration between Power BI and JD Edwards enables real-time data connectivity, ensuring that you have access to the most up-to-date information. With Power BI’s ability to connect to multiple data sources, including JD Edwards databases, you can centralize data from different modules and systems, creating a unified view of your organization’s performance. This seamless integration facilitates better decision-making by providing accurate and timely information to users across departments.
3. Interactive Data Exploration and Drill-Down Capabilities:
Power BI empowers users to dive deeper into their JD Edwards data through interactive data exploration and drill-down capabilities. With just a few clicks, you can filter, sort, and analyze data at various levels of granularity, enabling you to uncover insights and identify trends that might have otherwise gone unnoticed. This flexibility promotes a data-driven culture within your organization, where users can easily explore data, ask questions, and find answers to make informed decisions.
4. Advanced Analytics and Predictive Insights:
Beyond traditional reporting and visualization, Power BI offers advanced analytics capabilities that can revolutionize your JD Edwards data analysis. By leveraging machine learning algorithms and predictive modeling, Power BI can provide valuable insights into customer behavior, demand forecasting, inventory optimization, and more. These predictive insights empower businesses to proactively identify opportunities and mitigate risks, leading to improved operational efficiency and competitive advantage.
5. Mobile Access and Collaboration:
In today’s mobile-centric world, it is crucial to have access to data and insights on the go. Power BI’s mobile app allows users to access their JD Edwards dashboards and reports from any device, anytime, anywhere. This mobility enables executives, managers, and field personnel to stay informed and make critical decisions even when they are away from their desks. Additionally, Power BI’s collaboration features enable users to share dashboards and reports with colleagues, fostering a data-driven culture of collaboration and knowledge sharing.
Requirements for businesses for successful integration
To ensure a seamless integration of Power BI with your ERP system, several key business requirements must be met:
- Defined Business Objectives: Set data analytics goals including operational efficiency, financial transparency, and customer happiness.
- Comprehensive Data Access: Make sure all ERP data sources are accessible and ready for integration. Financial, operational, and consumer data are included.
- KPIs and Metrics: Define the KPIs and metrics needed to track and analyze business performance.
- Robust Infrastructure: To protect sensitive data and handle analytical workloads, your IT infrastructure should provide integration and data protection.
Steps for Working with Us on Power BI Integration with your ERP System
![Untitled_design__28_-removebg-preview (1) [:en]Untitled_design__28_-removebg-preview (1)[:]](https://cobit-solutions.com/en/wp-content/uploads/sites/2/elementor/thumbs/untitled_design__28_-removebg-preview-1-e1722362724916-qrvt4vt0ir0yp8i3osc3lo1nj3c5y98h2dxrjkcxk8.png)
Initial Consultation
![Untitled_design__28_-removebg-preview (1) [:en]Untitled_design__28_-removebg-preview (1)[:]](https://cobit-solutions.com/en/wp-content/uploads/sites/2/elementor/thumbs/untitled_design__28_-removebg-preview-1-e1722362724916-qrvt4vt02ynuir5yhz82ua28r90s182tcjhi4nsby8.png)
Requirement Gathering
![Untitled_design__28_-removebg-preview (1) [:en]Untitled_design__28_-removebg-preview (1)[:]](https://cobit-solutions.com/en/wp-content/uploads/sites/2/elementor/thumbs/untitled_design__28_-removebg-preview-1-e1722362724916-qrvt4vt02ynuir5yhz82ua28r90s182tcjhi4nsby8.png)
Custom Solution Design
![Untitled_design__28_-removebg-preview (1) [:en]Untitled_design__28_-removebg-preview (1)[:]](https://cobit-solutions.com/en/wp-content/uploads/sites/2/elementor/thumbs/untitled_design__28_-removebg-preview-1-e1722362724916-qrvt4vt02ynuir5yhz82ua28r90s182tcjhi4nsby8.png)
Seamless Integration
![Untitled_design__28_-removebg-preview (1) [:en]Untitled_design__28_-removebg-preview (1)[:]](https://cobit-solutions.com/en/wp-content/uploads/sites/2/elementor/thumbs/untitled_design__28_-removebg-preview-1-e1722362724916-qrvt4vt02ynuir5yhz82ua28r90s182tcjhi4nsby8.png)
Training and Support
![Untitled_design__28_-removebg-preview (1) [:en]Untitled_design__28_-removebg-preview (1)[:]](https://cobit-solutions.com/en/wp-content/uploads/sites/2/elementor/thumbs/untitled_design__28_-removebg-preview-1-e1722362724916-qrvt4vt02ynuir5yhz82ua28r90s182tcjhi4nsby8.png)
Review and Optimization
Successful Integration Projects
Cobit Solutions has a history of successful Power BI integrations, enhancing business operations across various industries.
Working with Cobit Solutions will let your company use innovative Power BI tools to convert data into strategic insights. Our services are meant to maximize company operations, improve financial control, and offer thorough access to several performance criteria.
Our customized solutions provide the flexibility and depth required to support informed decision-making across all levels of your company, whether your goals are to improve customer analytics, simplify reporting systems, or get better financial predictions.

The developed perfectly looking Bl templates allow our clients to quickly build their first report in Power Bl and include the most relevant KPIs for reports. – Anna Odrynska, CSO at Alpha Serve

Get in Touch with Us
To connect your ERP with Power BI fill out the form on our website. Our client managers will reach out to discuss the details within 24 hours.
Once the project begins, you can expect to see the first results within 1 month. Our Power BI solutions provide interactive, real-time reports, enabling quick and informed decision-making for directors and other key stakeholders. These dashboards automatically refresh, eliminating the need for manual calculations and presenting vital KPIs tailored to each department’s needs, ensuring the success of your company.
For streamlined, effective management and insightful analytics, start your Power BI integration with us today.
Developing the business becomes more comfortable when you regulate the workflows according to the fast reports with interactive analytics.
Dashboards creation


You might also be interested in the article by the owner of Cobit Solutions Why does my company need business intelligence?
Read more on real cases of BI system implementation in different industries on our Blog


