Save money & time with
business dashboards


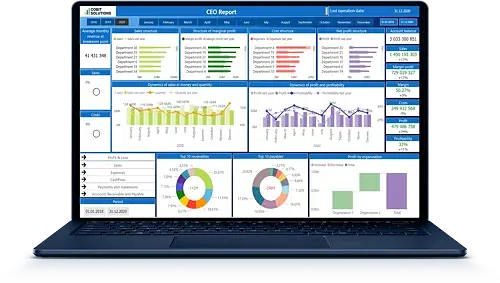
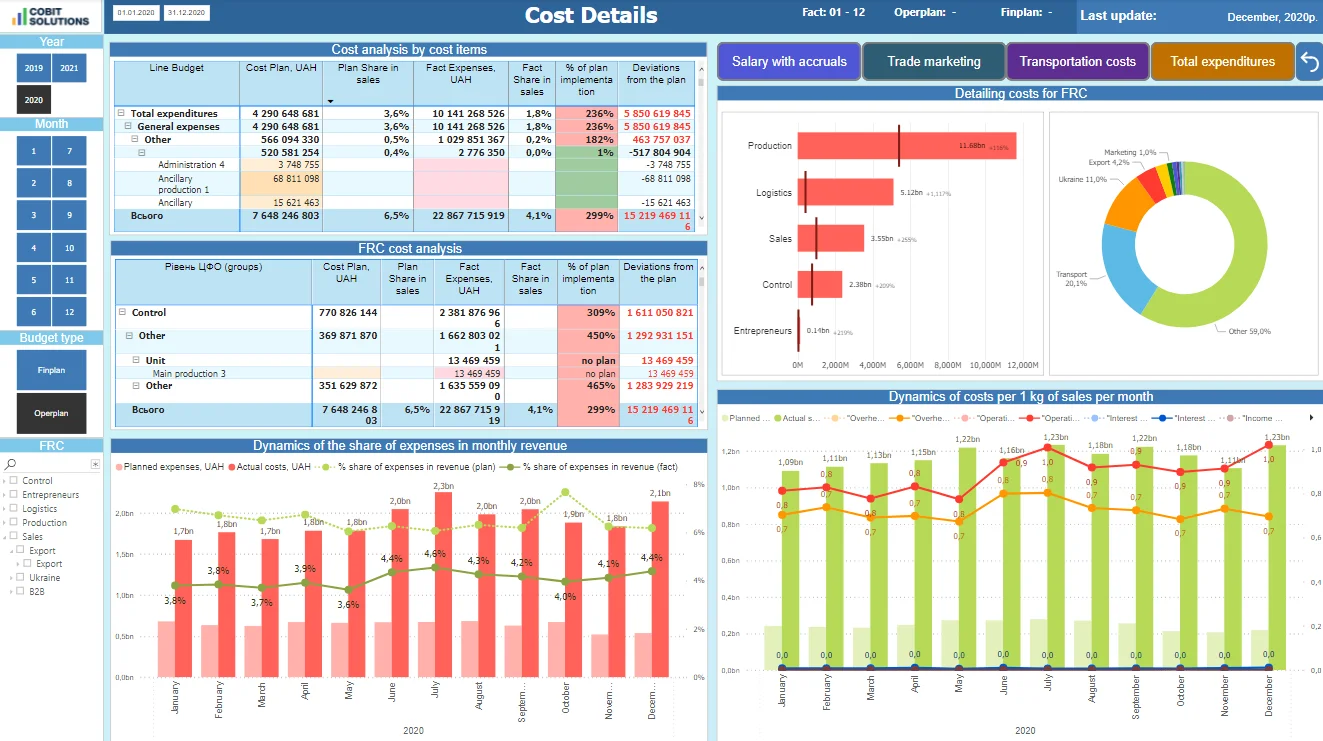
Manage business with Power BI
top-notch data visualization platform
Turnkey DWH ETL data integration services for ERP, API, CRM, DB, Excel sources
Transforming your data silos into
high-end decision-making tool
REQUEST YOUR FREE CHECKLIST
for business intelligence succesfull implementation