
DOWNLOAD FREE CHECKLIST
of 25 recommendations for successful BI implementation


How many times have you prepared a monthly report to manager for a meeting, only to feel helpless three questions later? Scribbling notes ‘for the next time’.
of 25 recommendations for successful BI implementation
We commit to deliver a comprehensive, turnkey BI & DWH solution within 4 months

27 Oct 2021
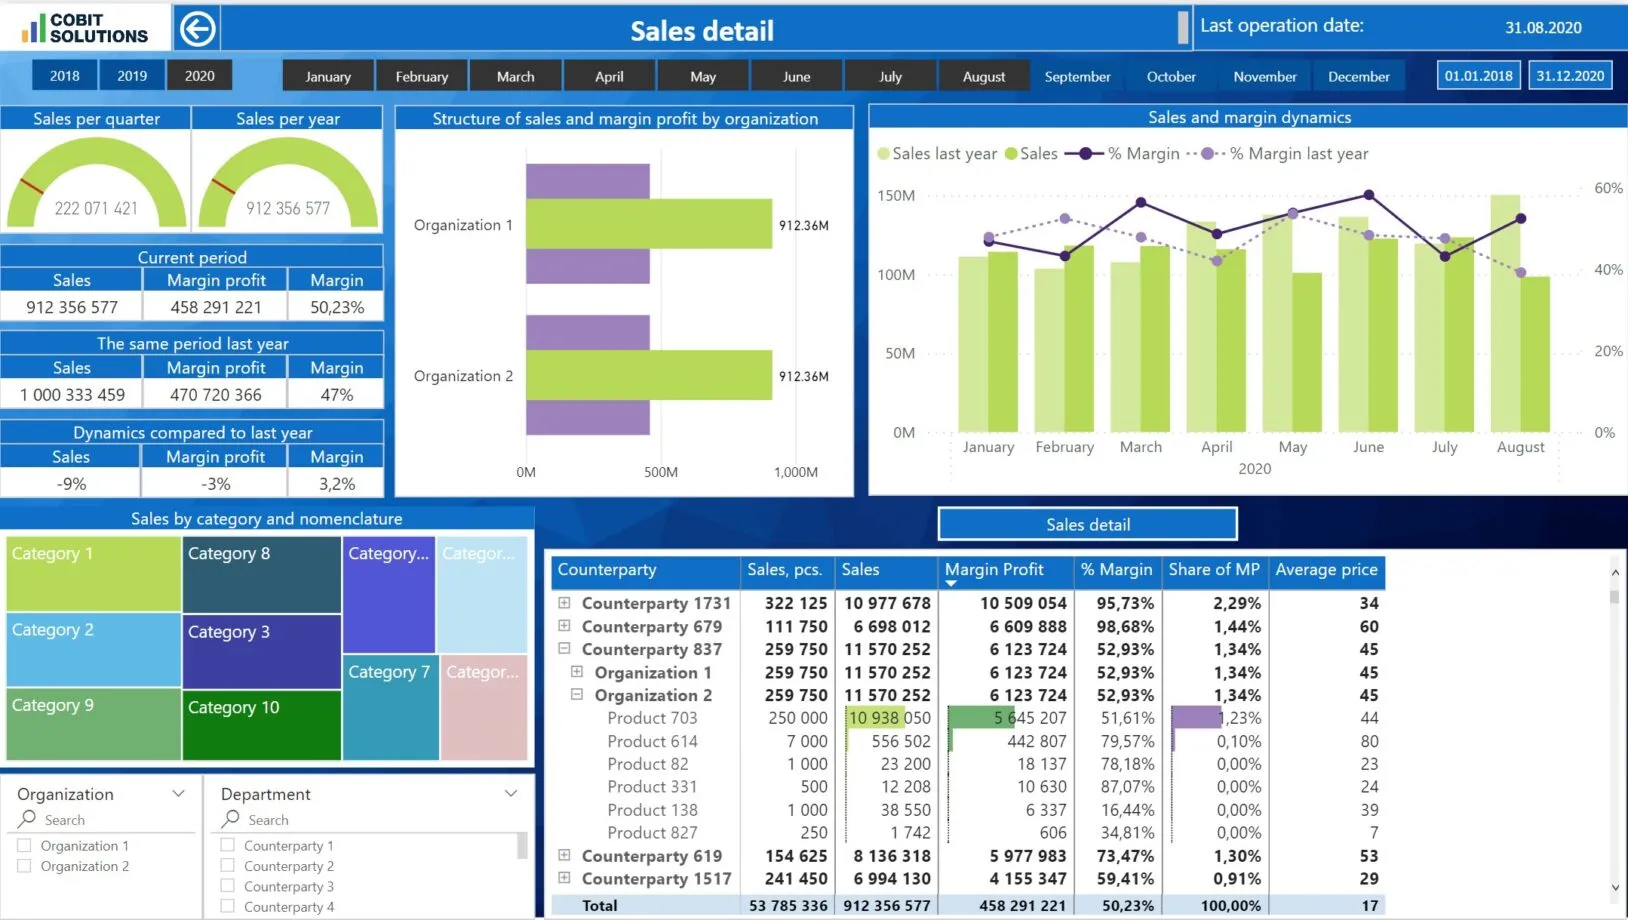
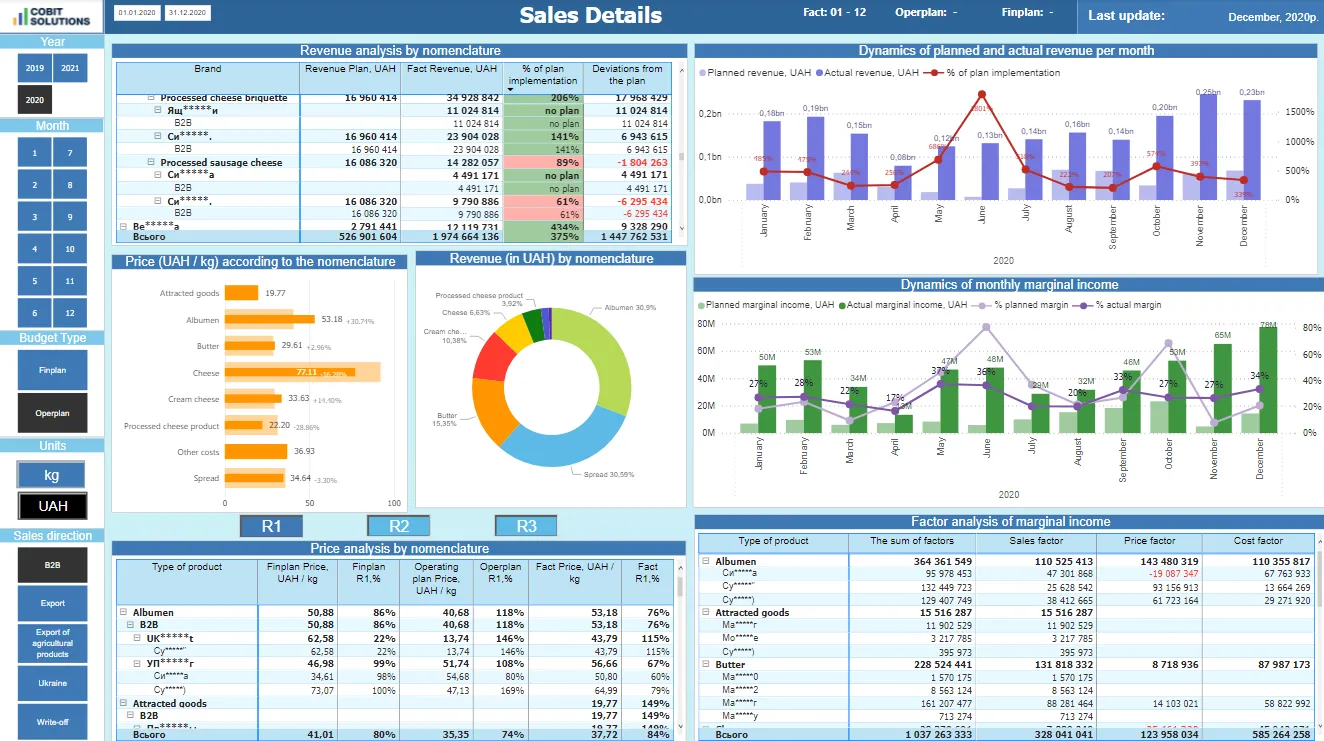
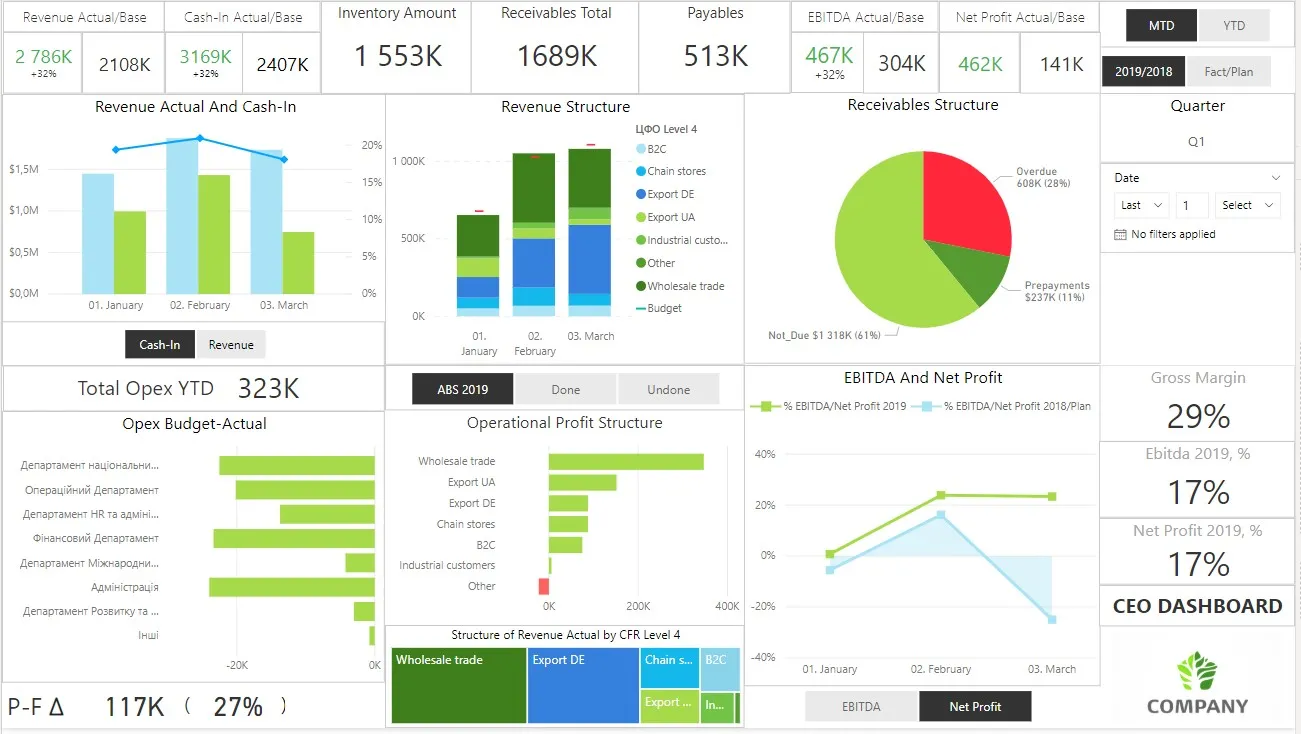
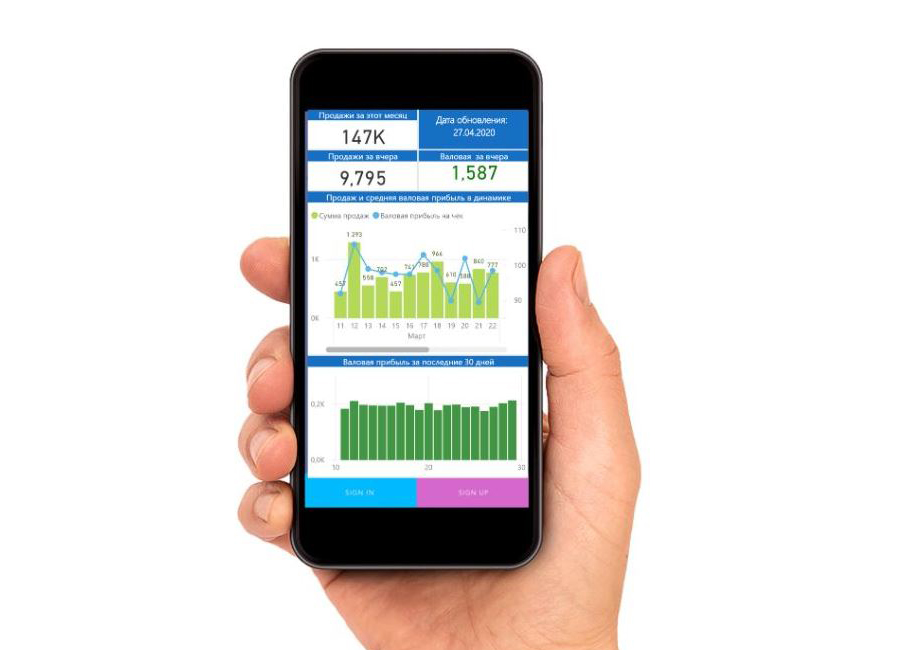
Accounts receivable dashboard: Keep an eye on them!When you ship your productcs, do you defer payment? Do you sell to any major chains? Are you sure they’ve paid for everything or do yo ...
Read More
23 Apr 2026
How to go from the chaos of hundreds of thousands of metrics to analytics with 99% accuracyCase study of a data warehouse and BI implementation for a global manufacturing company. Learn how to integrate data from 8 ERP systems and ...
Read More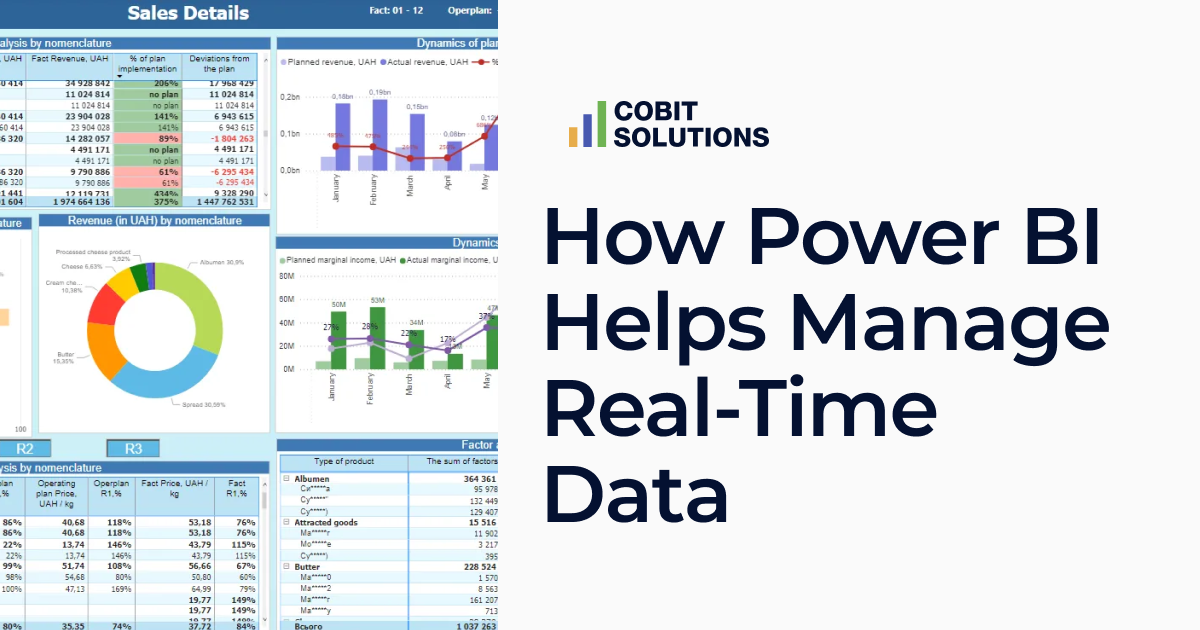
21 Oct 2024
How Power BI Helps Manage Real-Time DataDiscover how Power BI empowers businesses to manage real-time data effectively with dynamic dashboards and actionable insights ...
Read More457
dashboards created in 2025150+
years of IT experience among employees22
data experts & BI consultants12B
USD annual revenue of clients that utilize our analytics solutions