Accounts receivable is an asset, the money that someone owes us. But if they aren’t managed correctly, there will be no real money, even for the paychecks.
BENEFITS OF “ACCOUNTS RECEIVABLE” DASHBOARD
It allows you to see the current amount of accounts receivable for your company, the timeline and the dynamics.
It makes it possible to fall through to each counterparty, to see the date when deferral was initiated for all payments or transactions.
It helps to control the percentage of the funds turnover and to decide whether to put on hold certain shippings or stop cooperating with a non-paying counterparty altogether.
It points out the problematic counterparties, thus facilitating the control of deferral dates for each counterparty.
It visualizes the problematic spots and overdue receivables
It details the debt and helps to control the financial responsibility of counterparties
HERE'S WHY OUR CUSTOMERS CLAIM THAT IMPLEMENTING BI SYSTEMS INCREASES PROFIT
- Routine monitoring ultimately leads to increased profits and to business growth
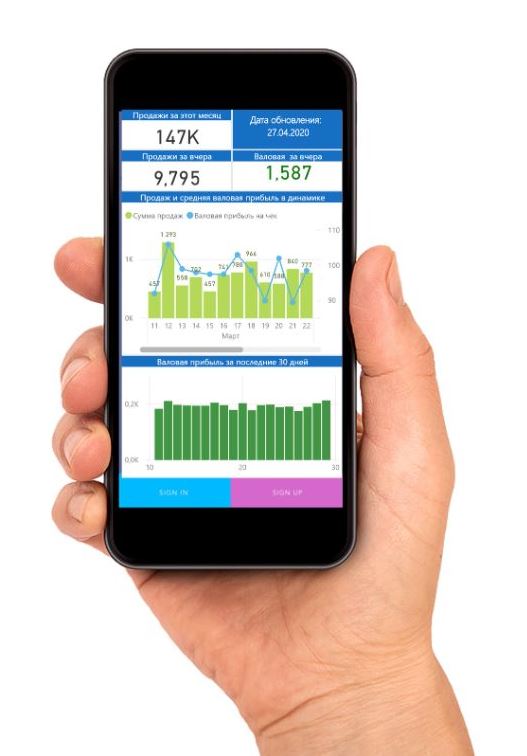
- Graphic dashboards provide a chance to control the revenue, cost price, margin and the gross profiе on a daily basis. No need to wait for a monthly report.
- You might also like to read the article by the owner of Cobit Solutions: BUSINESS INTELLIGENCE FOR INSURANCE
- Read more on the real cases of BI system implementation in different industries in our BLOG
- BI-solutions FOR SMALL BUSINESSES
BUT THE MAIN POINT OF THE ANALYTICS IS
PROFIT GROWTH
Our dashboards give you a chance to control the revenue, cost price, margin, gross profiе and 47 other indicators on a daily basis. No need to wait for a monthly report.
Consistent control results in profit growth and business expansion.


