Home » Blog » Case study: Why you Can’t Rely on Gross Income as an Indicator?

Case study: Why you Can’t Rely on Gross Income as an Indicator?

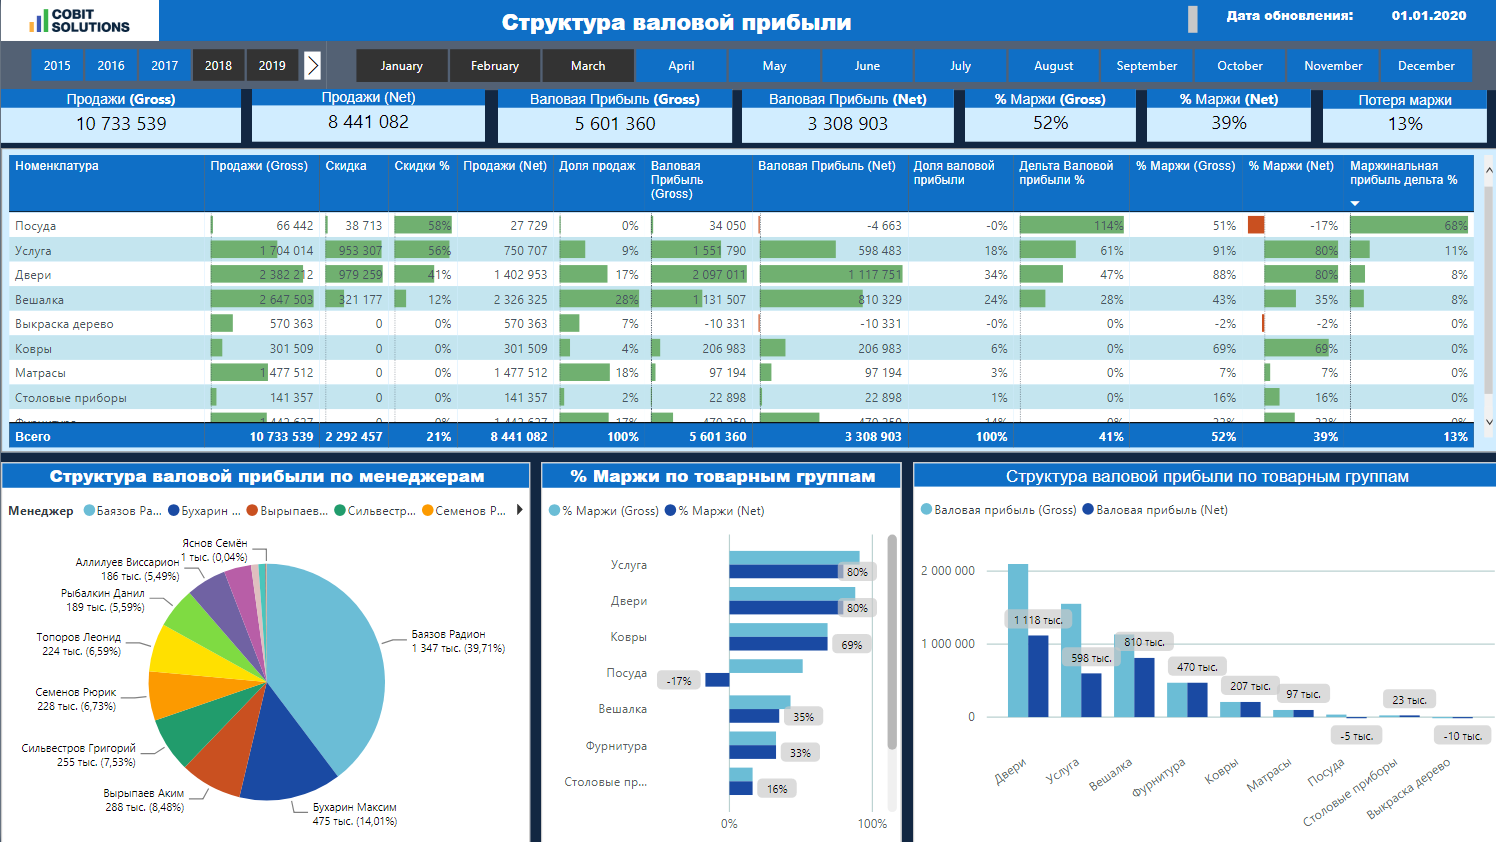
A company’s profit isn’t proportionate to its income. Is this obvious? Not necessarily so. Let me share a story from my experience with a customer in the production industry.

dashboard for management

EFFICIENCY OF A MANAGER’S WORK AS PART OF A BUSINESS ANALYSIS

Well, here’s a manager who works his socks off all month and does sales of huge amounts, demands an embarrassingly big turnover bonus in the end of the month, but the profit he brings is nothing to speak of. This happens because he sells non-marginal items, grants discounts, and eventually drains off the whole margin. 

And there’s another one who completes 10 transactions but brings 5 times as much gross profit. 

To be fair, a gross profit report normally takes a very long time to prepare. And it isn’t always demonstrated to the managers. But even if it were demonstrated, what would they make of it? It only contains the total sales in the area versus the analytical dashboard for management

Read how to track the main economic factors with  BUSINESS INTELLIGENCE FOR INSURANCE 

WHAT WILL THE ANALYTICS GIVE THE COMPANY

Our dashboard allows the managers to keep track of the gross profit they have brought in every day, and to see their place overall.

In a BI system, the sales managers can monitor the gross profit by transactions, by areas of sales, and by particular goods. And this means that every manager understands what is more profitable to sell for them (and for the company), how much they should sell, and how they increase their financial results. And also, this encourages competition among the staff!

Now the company is changing the managers’ motivation from turnover to gross profit and planning to build up 2-3% of gross profit this way. And you do know, dear friends, this is really a helluva lot. If you are interested in an opportunity of setting up interactive reporting, please contact us.

BUT THE MAIN POINT OF THE ANALYTICS IS
PROFIT GROWTH

Our dashboards give you a chance to control the revenue, cost price, margin, gross profiе and 47 other indicators on a daily basis. No need to wait for a monthly report.

Consistent control results in  profit growth and business expansion.

GET COMPANY MANAGEMENT DASHBOARD

Cobit Solutions

More articles and cases

Power BI Implementation Process

22 Jan 2022

Power BI Implementation Process

How long does it take to develop one? What is the process like? What are the stages of a BI system implementation? First of all, you should ...

Read More
Case study. Find a BI solution for a Fashion Retail company

09 Mar 2022

Case study. Find a BI solution for a Fashion Retail company

The purpose of implementing Power BI in retail: Fix the malfunctions in the current analytics software. Refine the existing add-on that ext ...

Read More
Business Intelligence for Insurance Report & Dashboards OLD

09 Jun 2022

Business Intelligence for Insurance Report & Dashboards OLD

Find out  the business intelligence advantages in insurance for successful management of any size businesses up to widely developed ones.   ...

Read More

KEY FIGURES OF THE COMPANY

457

dashboards created in 2022

150+

years of IT experience among employees

17

data experts & BI consultants

12B

USD annual revenue of clients that utilize our analytics solutions