
DOWNLOAD FREE CHECKLIST
of 25 recommendations for successful BI implementation


How long does it take to develop one? What is the process like? What are the stages of a BI system implementation?
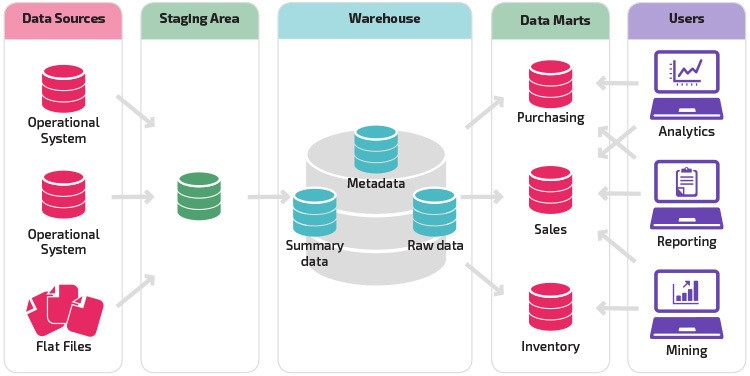
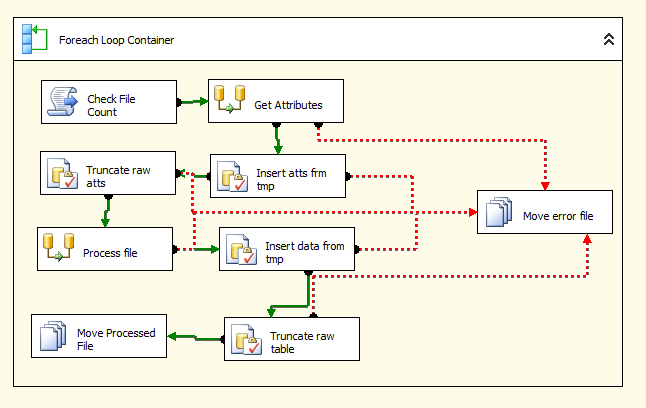
First of all, you should understand that the elegant data account for 20% of the volume of work. This is only the tip of the iceberg.
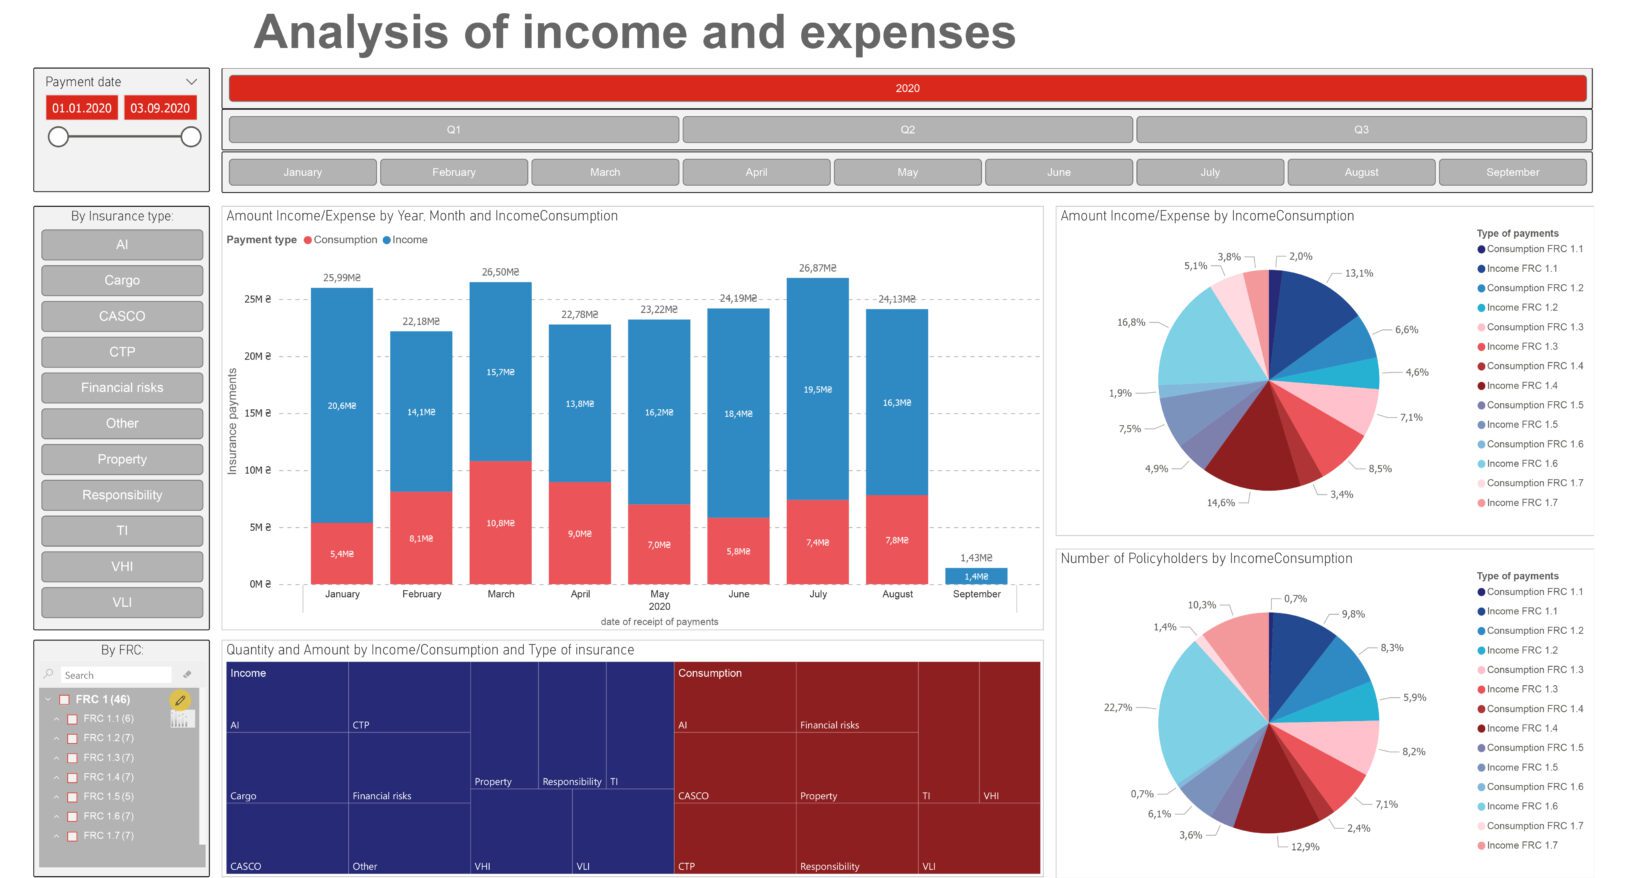
Let’s get an understanding of the process of turning Excel tables into comprehensible and appealing dashboards that contain the data on your business or subdivision.
of 25 recommendations for successful BI implementation
Cobit Solutions commits to delivering a comprehensive, turnkey solution within four months

21 Feb 2023
Power BI Manufacturing DashboardThe Power BI tools have shown their significance for the decision makers because they are available from any point in the world, and are reg ...
Read More
14 Jan 2022
Power BI in healthcare case study – managers keep their finger on the pulseThe dashboards hepled each of the managers at their level to receive the daily reporting they needed in dashboards, by the time they came to ...
Read More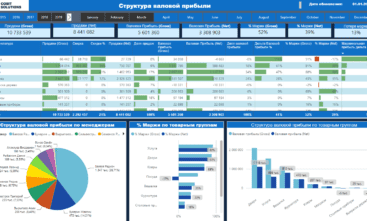
22 Jan 2022
Case study: Why you Can’t Rely on Gross Income as an Indicator?A company’s profit isn’t proportionate to its income. Is this obvious? Not necessarily so. Let me share a story from my experience with a cu ...
Read More457
dashboards created in 2022150+
years of IT experience among employees17
data experts & BI consultants12B
USD annual revenue of clients that utilize our analytics solutions