Home » Blog » Top 12 Power BI Dashboard Reports Examples in 2024

Top 12 Power BI Dashboard & Reports Examples in 2024

The ultimate goal of any business is making profit. And in the times of a crisis it is also minimizing the cash shortages.

Let me use 12 main Power BI examples reports to show you how the Power BI interactive reporting works and what tasks it can solve.

The ultimate goal of any business is making profit. And in the times of a crisis it is also minimizing the cash shortages. These tasks are taking time and demand from decision-makers for right and timely decisions using a huge number of workflow metrics. To make the data work for growth and strategic goals interactive analytics works with dates to calculate the KPIs and show the results of business and what is happening.

The following financial Power BI reports examples will show you how the Power BI interactive reporting works and what tasks it can solve. Power BI reports work with all the vital data collected by CRM or ERP and any other system before you open the dashboard and check the most important KPIs.

1. KPI KEY PERFORMANCE INDICATORS

These are a company’s digitized goals for the year. The KPIs are often displayed in Excel or in the system of indicators (Balanced Scorecard). 

What are the benefits of KPIs in Power BI: 

  • They consolidate the cash receipts and the margin from ERP, the sales from CRM, the indicators from any other systems, and the plans from Excel into one dashboard; 
  • KPIs Power BI help control the achievement of the financial goals in real time; 
  • They show the comparison with the previous period and plan: Plan/Fact, YoY, Like4Like; 
  • Business intelligence KPIs allow for financial modeling and scenario forecasting with reference to the influence of factors.

You might find this interesting: WHY DOES MY COMPANY NEED BUSINESS INTELLIGENCE?

2. FINANCIAL DASHBOARDS BI REPORT EXAMPLES

Financial Power BI reports examples serve businesses to analyze a sea of data, metrics, vital indexes and put them together for an understandable picture. 

Power BI technology provides a cloud based solution to show the reports on any device via the Internet. The system collects all the data and visualizations to your daily updated report.

Financial dashboard is the key to get a plethora of data, analyze and guide the workflows and processes to financial goals. 

This tool makes it easier to identify trends and spot potential issues. Power BI’s advanced data analytics helps our clients look for efficiency improvements, places to cut costs, fraud, and areas for increases in income. In other words Power BI reports examples can show the state of your business and financial health.

Read how to track the main economic factors with  BUSINESS INTELLIGENCE FOR INSURANCE 

3. THE PROFIT AND LOSS: P&L POWER BI EXAMPLE REPORT

What are the benefits of P&L in Power BI: 

  • It demonstrates the growth or decline factors
  • It shows the cost reduction and profit increase points
  • It visualizes the diagrams of expenditure, marginal profit, revenue, and the dynamics for each of those broken down by day, month, and quarter
  • It helps control the actual or short-received profits on a day-to-day basis. 
  • It helps compare the indicators with the previous periods or budgets
  • It details every indicator, for example, to the counterparty and the particular accounts receivable period

Read how to track the main economic factors with  BUSINESS INTELLIGENCE FOR INSURANCE 

4. CASHFLOW: THE MOVEMENT OF FUNDS POWER BI EXAMPLE REPORT

One of the most important financial Power BI dashboards is Cashflow dashboard, which visually represents company’s money in the accounts for the periods. This business reporting tool gives the possibility  to filter data, choose time periods, add real-time data and clone brand new Power BI dashboards on the base of the implemented system.

What are the benefits of CashFlow in Power BI: 

  • It clearly illustrates the situation why the company finishes the year with a profit but with no money in its accounts; 
  • It shows the actual amount of money in the accounts
  • It divides the cash flow into the operational and investment flows
  • It offers the opportunity to fall through to every bank statement; 
  • It merges several report sources (ERP, OLAP cubes, Terrasoft) and displays the balance for all of them on one dashboard;

This interactive report provides the company state of the year finished by profit and money.

5. FACTORIAL ANALYSIS OF INCOME AND MARGINAL PROFIT

The dashboard shows how the sales in units, the price, the discounts, the dollar exchange rate, the production cost, the expenditures on marketing, distribution, logistics, and other factors influence the aggregate financial result. 

It enables the company to: 

  • Get an understanding of the factors’ impact on the gross profit on a day-to-day basis.
  • Control the margin for different sales channels.
  • Keep track of the dynamics of sales and production cost.
  • Keep track of the dynamics of the factors.
  • Keep track of the marginality of a particular transaction, goods or service.

To get the most matching system and develop the project use our Power BI consulting services

interactive report

6. RETAIL DASHBOARD BI REPORT EXAMPLES

The retail analytics dashboard is developed to monitor top-selling items and show the information of stock availability. It clearly illustrates the situation that necessary products are available in all stores. Retail managers use this Power BI reports examples to avoid hard times with out-of-stock  products and supplies for customers or overstock for managers.

It helps the companies to: 

  • Use the most vital data and metrics for better results.; 
  • Make the store-wise revenue analysis.
  • Provide items for orders placed
  • See which category provides higher profit despite less sales volume
  • Facilitate decisions concerning future investments and store plans
  • Control the revenue, cost price, margin and the gross profit on a daily basis
power BI retail

You might find this  interesting: WHY DOES MY COMPANY NEED BUSINESS INTELLIGENCE? 

7. STORE PERFORMANCE DASHBOARD

Store performance Power BI reports examples are meant to visualize the state of necessary products availability in all stores and following strategic goals.

It enables data driven decision making in-spite the fluctuations of demands and supply. 

Its advantages are:

  • Assurance in sales increasing; 
  • Strategic goals following and reports forecasting nevertheless the geographic locations, weather, social media hype etc.
  • Basket metrics tracking provides the improvements due to up-selling and cross-selling.
  • Adds insights concerning the pricing strategy.

All the insights from this Power BI solution are crucial for the decision-makers. 

8. MARKETING DASHBOARD

Marketing Dashboard  clearly illustrates the situation with metrics and analytics that matter to marketers of any level for quick and easy understanding and future decision-making. Digital marketing report dashboards are timesaving for the decision makers to get any time updated Power BI reports examples from cloud-based service about social media analytics, website analytics data, or campaign metrics separately.

Selected key performance metrics (KPIs) are important for the quick decision-making to manage intime the marketing tactics or reallocate resources, choose the channel of promotion etc.

This dashboard advantages are:

  • Сonsolidating and arranging data on a single page report to get the vital insight at a glance
  • Personalize customer relationship management, forecast the campaign results, and regulate the workflows
  • Identify spend on and top/bottom performing products across each marketing funnel
  • Analyze conversion rate marketing funnel metrics at an overall and detailed levels

HOW BI INCREASES THE PROFIT

Opting for Power BI allows you to control the income, production cost, margin, and gross profit every day, without having to wait for the monthly “summarization” of reporting.  Eventually, regular control results in an increase in profit and growth of your business.   If you are interested in the possibility of configuring interactive reporting, please contact us. 

9 SALESFORCE DASHBOARD

The interactive analytics tool shows the most meaningful data as a company’s sales, activity of each member and results of services provided. It helps process the current state of business, forecast the situation, provide better customer service and avoid the pitfalls before they become a problem.

Salesforce Power BI dashboard provide:

  • Detailed information report about clients.
  • Metrics of team performance for better motivation and rewarding
  • Detailed pass of the sales cycle stages
  • Offer excellent ROI (return on investment)

As the clients state after one month of their Power BI reports implementation companies show significant conversion rates increase, revenue by 29% and sales team productivity by 34%.

10. MANUFACTURING DASHBOARD BI REPORT EXAMPLES

Manufacturing analytics dashboard is a general type of Power BI dashboards however it can different for each industry plus the type of analysis you need. In manufacturing companies, an important issue is effective inventory planning to maximize Service Level to customers and minimize illiquid inventories. The main tool for effective planning is the preparation and visualization of MPS (Master Production Scheduling) based on the sales forecast. 

This plan reflects the provision of the necessary products to the forecast sales volume and the formation of a sufficient balance in the warehouse to ensure a high Service Level.

This dashboard advantages are:

  • Planning the supply of necessary raw materials
  • Shows what raw materials and goods need to be purchased, in what quantity, when and how
  • Draws up and analyzes DRP (Distribution Requirement Planning) plans for distribution network.
  • Allows effective management of the company’s inventory
  • Provides customers with a high Service Level

47 SUCCESSFUL COMPANY DASHBOARD
PROJECTS IN 22 INDUSTRIES

Cobit Solutions Cobit Solutions

11. SALES DASHBOARD

Sales report dashboard provides different types of analysis to report a real picture of your key performance indicators (KPIs) in sales. Sales analytics dashboard is a general type of Power BI dashboards.

Power BI reports’ advantages include:

  • Visual representation of your most recent performance, dynamics, structure and effectiveness of sales by main key dimensions of company activity by directions, contragents, products, etc.
  • Sales data for the periods plus what, when, where from, how much, whom, and how many were sold

12. CFO Dashboard

The most important for the financiers dashboard helps large business executives to see a full view due to the great number of IТ systems and poor integration between ERP, CRM systems, Excel, OLAP cubes and others.

CFO dashboard allows to “fall through” to the transactions, a bank statement, or any primary document. It analyzes the data for all the systems simultaneously.

Report’s advantages include:

  • Saves the CFO and the team hours of work
  • Consolidates data from delinked systems and minimizes errors
  • Details each indicator up to its primary documentation
  • Can locate the problem even before it escalated.
  • Builds communication with the CEO and the owner in terms that they can understand
  • Enhances their status in the company and helps them make strategic decisions
Business Intelligence

Conclusion

Modern solutions such as Power BI dashboards provide  marketers, CFO, heads, directors and other decision-makers the necessary key metrics analysis and empower them to focus on increasing ROI. To unlock the potential of data-driven decision-making, explore the innovative services offered by Cobit Solutions.


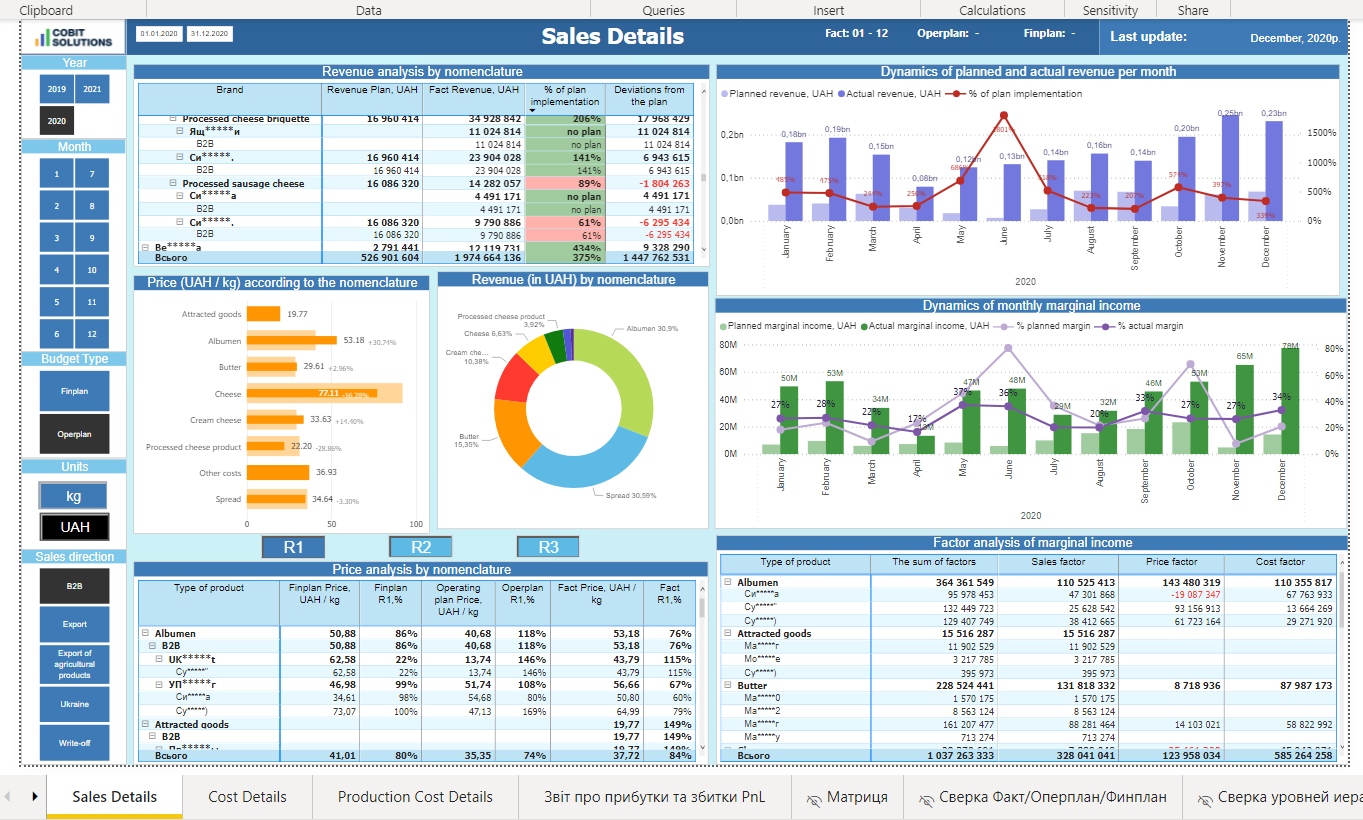
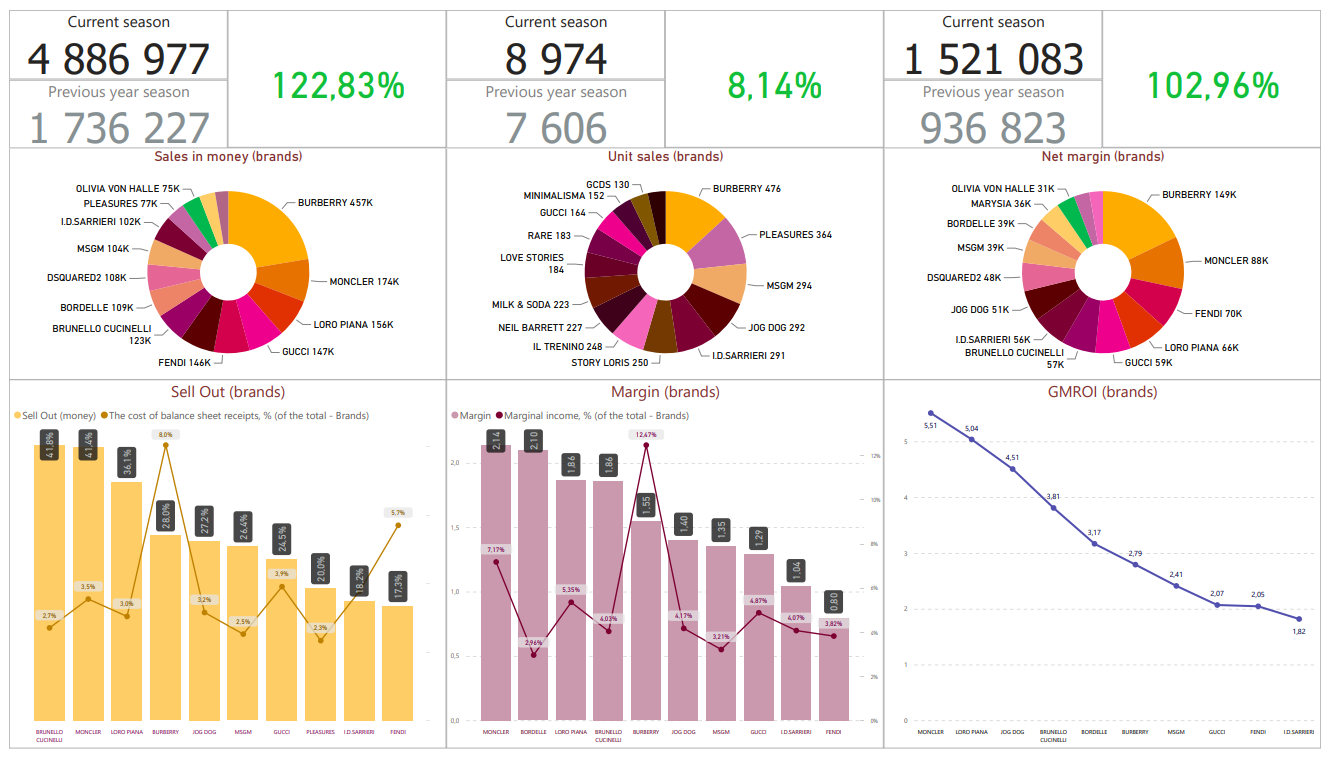
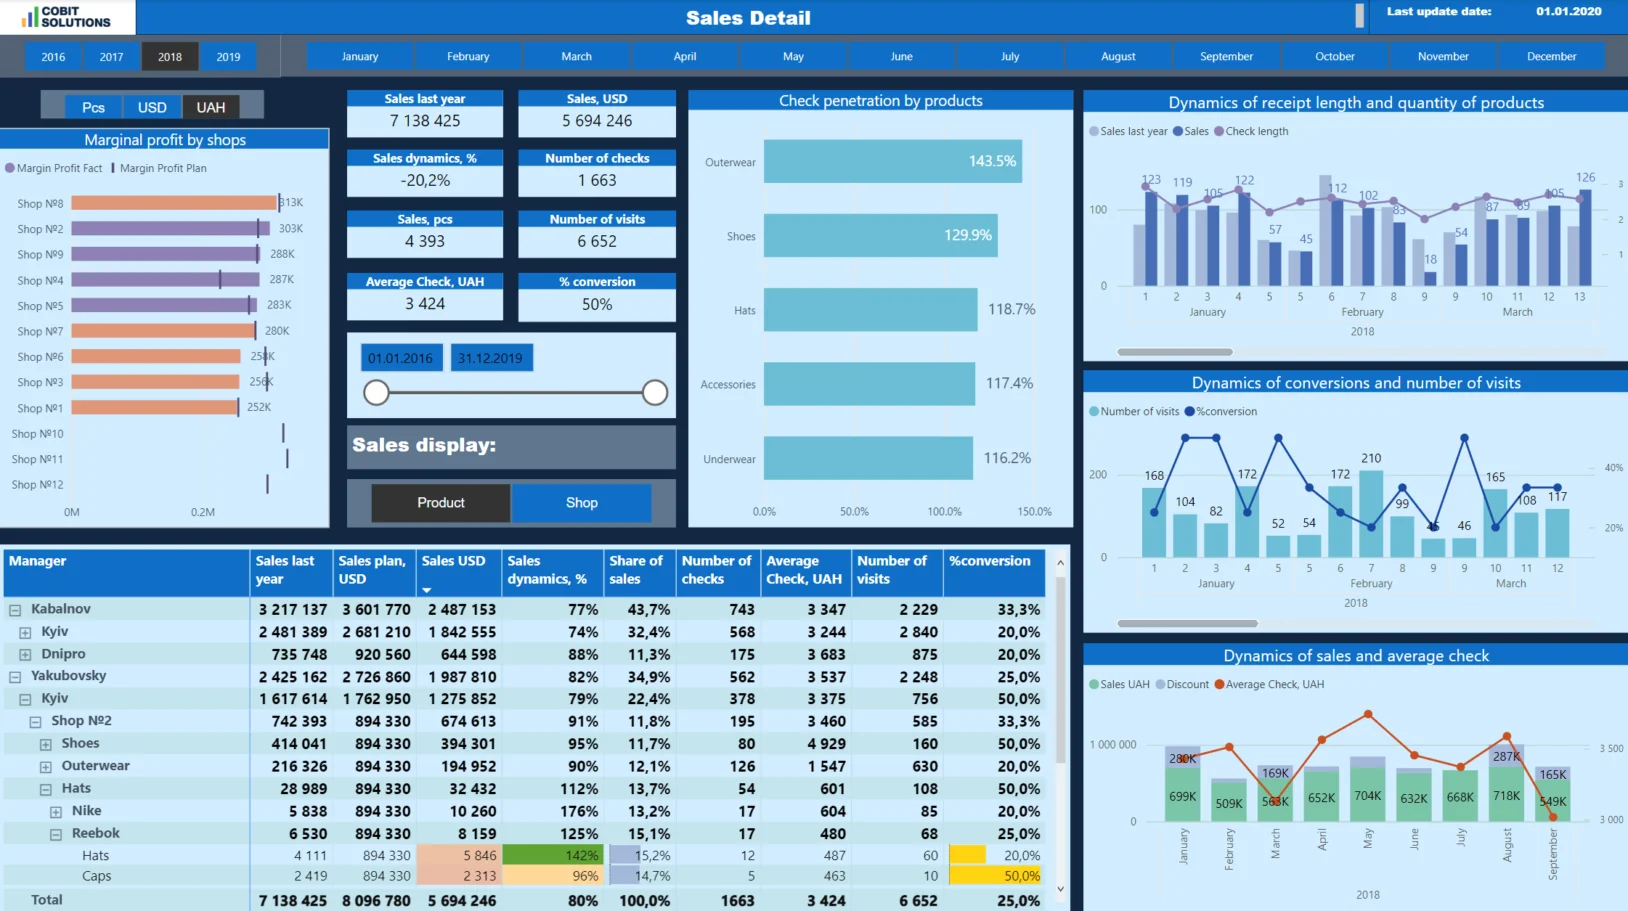
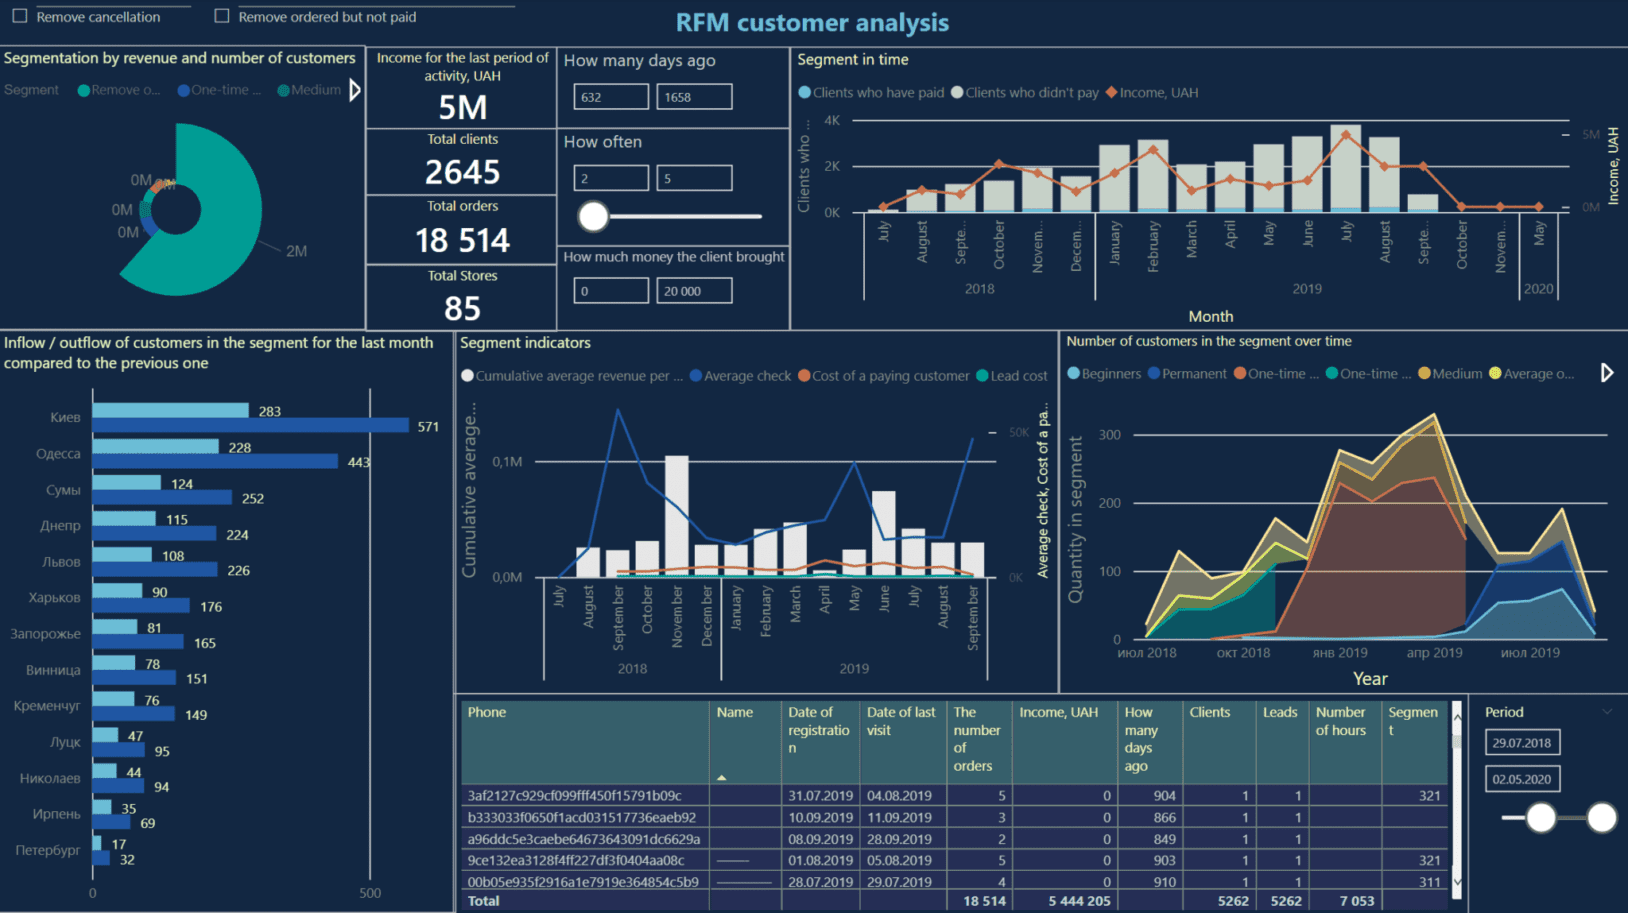
DATA MARTS AND BUSINESS DASHBOARDS

Data solutions that help companies increase revenue and profit margins

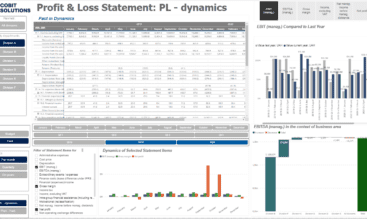
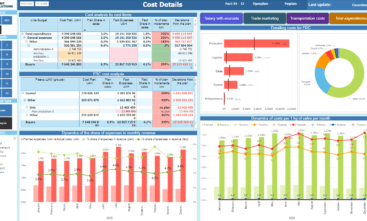
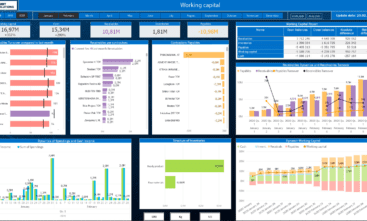
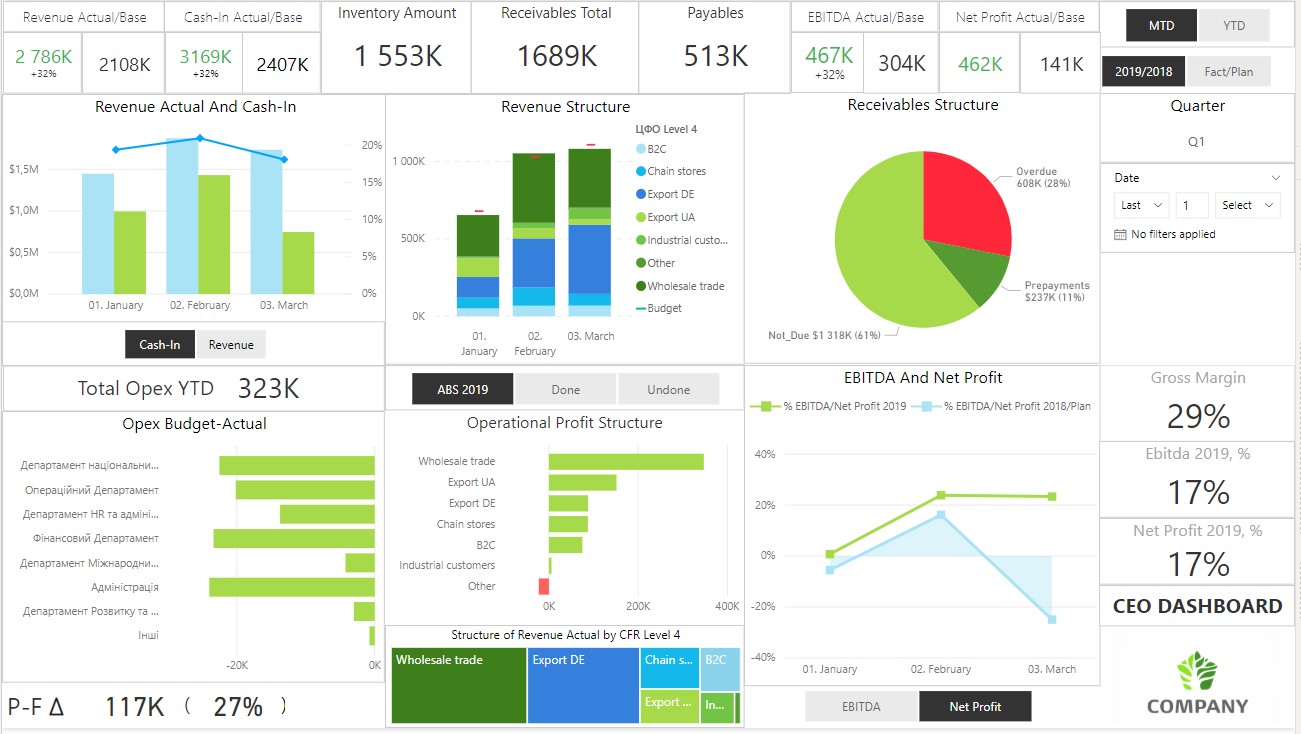
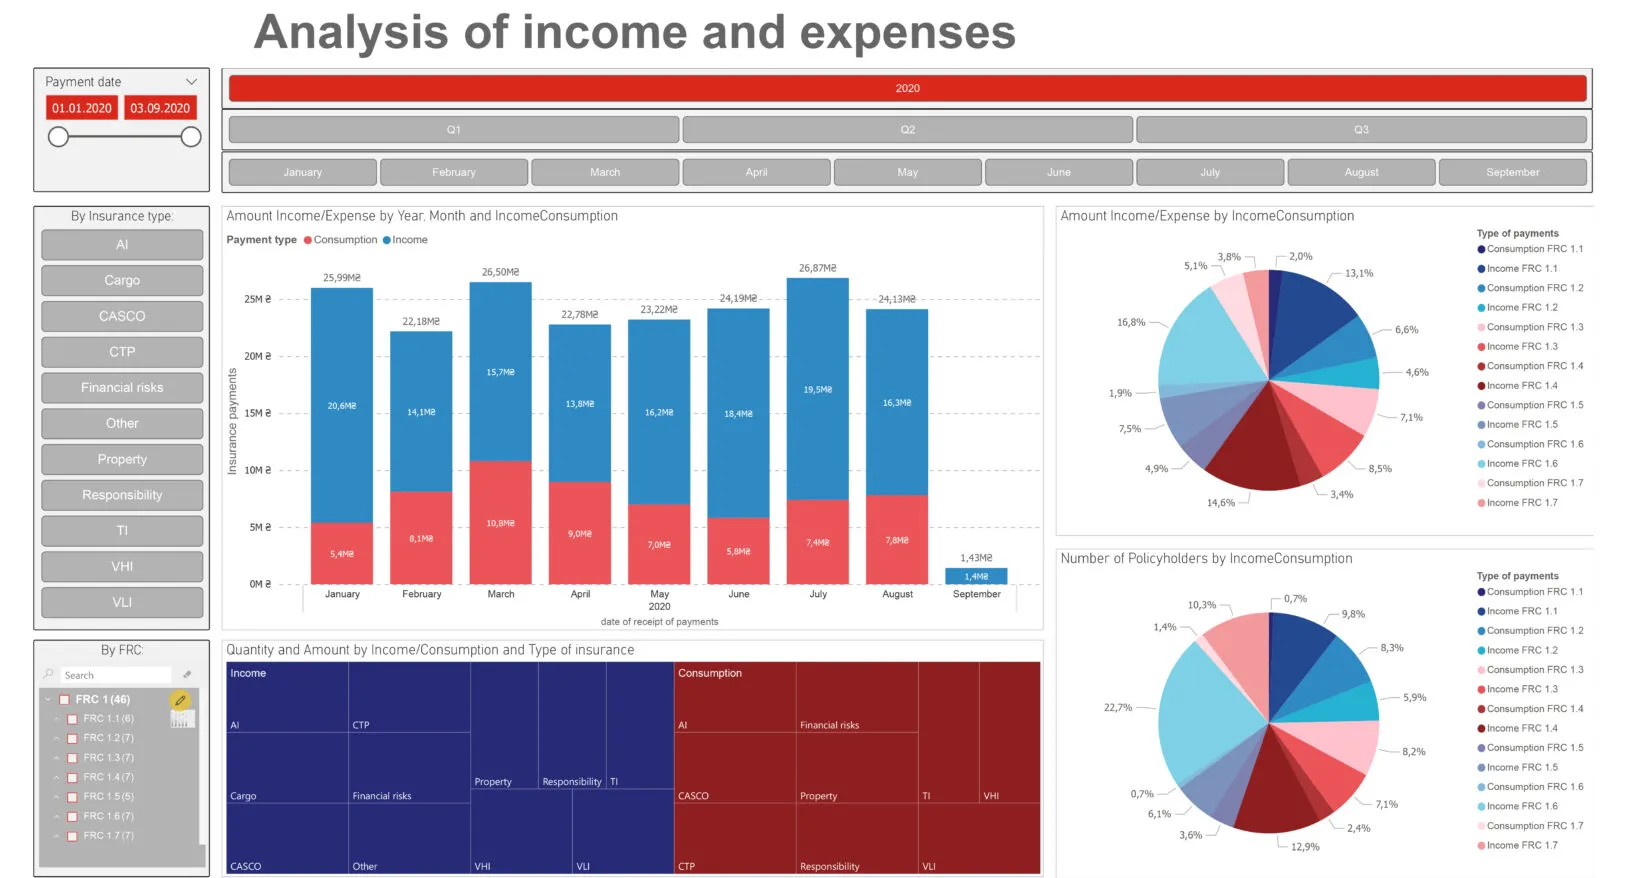
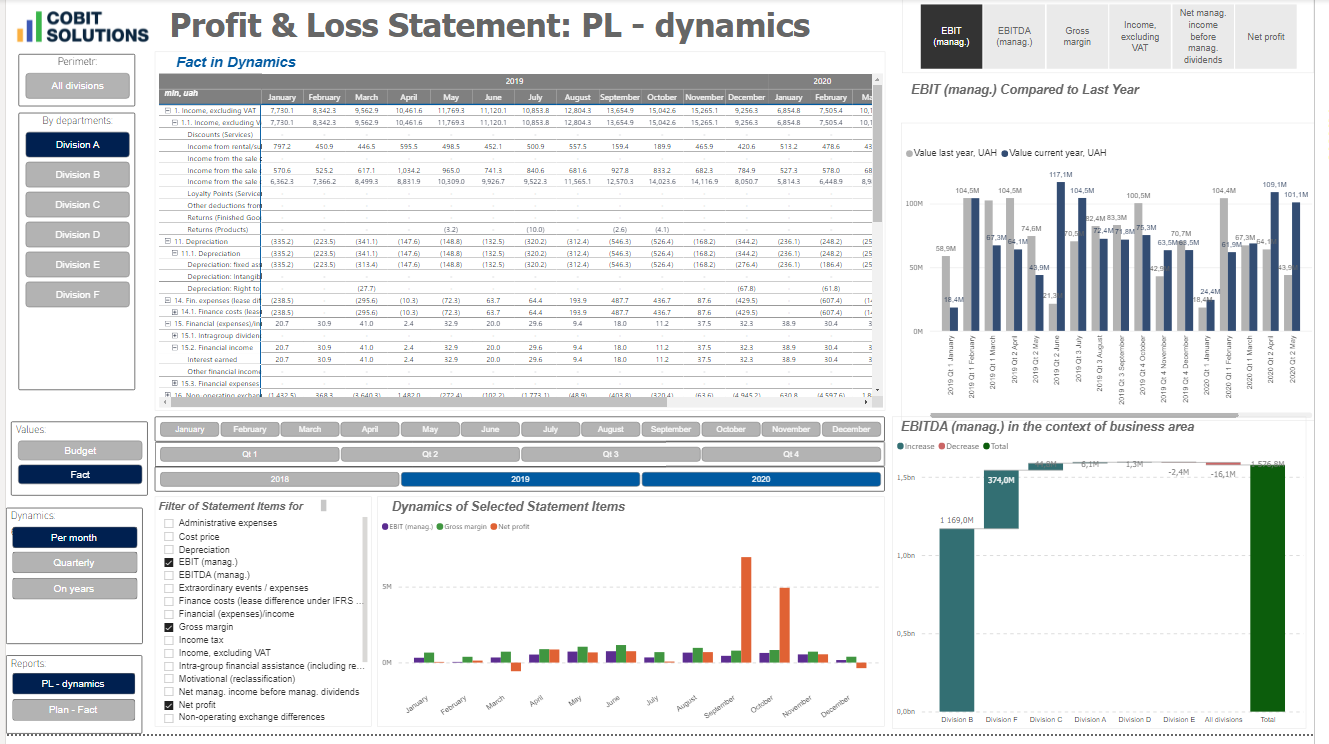
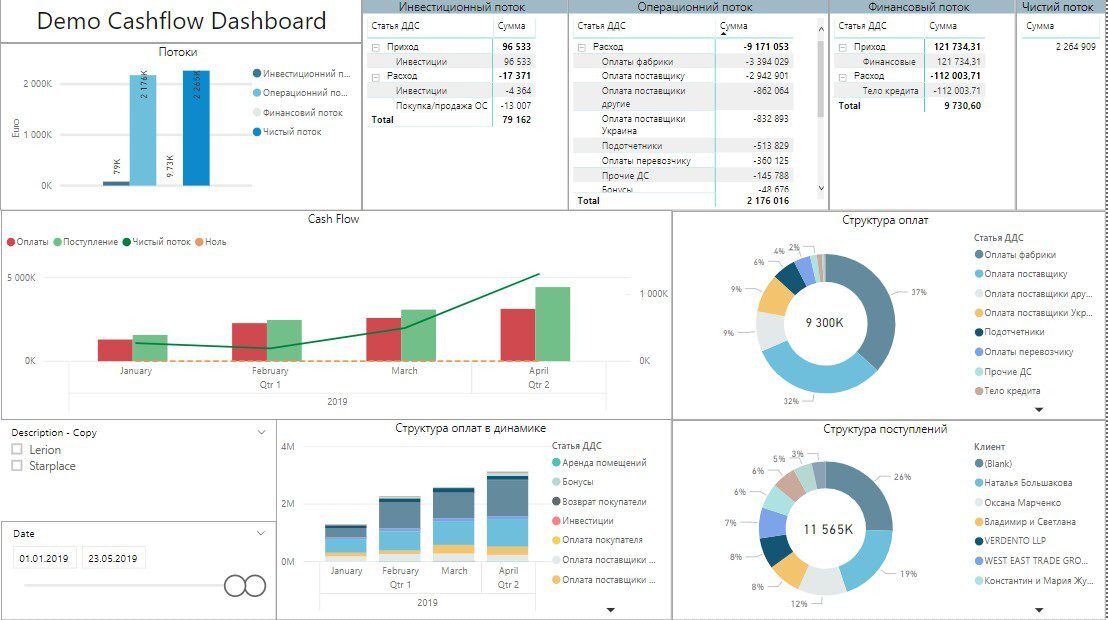
POWER BI DASHBOARD FUNCTIONALITY

You will be able to order a Business Management Dashboard to your purposes and different departmental needs. Company Dashboards can be designed and tailored specifically for any request you may have. After the Power BI System has been implemented you will receive your Retail Sales Analyses, Cash Flow of Funds, Factor Analysis of Sales, Retail Efficiency, and many other dashboards for your personal mobile or computer.
Cobit Solutions

OPTIONS FOR ANY BUSINESS

  1. For businesses who wants to develop on their own
  2. Mentoring subscription from $899/month
  3. 5 hours of BI Architect consulting per month
  4. Start within 1 week
  1. Analytics and business dashboard development project from scratch
  2. Fixed cost, turnkey result
  3. Minimizing risks, responsibility for the result
  4. Starts with system architecture design
  1. Dashboards development services or small BI projects
  2. Hourly rate from
    USD 35/hour
  3. Small tasks, flexibility, no monthly commitment
  4. Get your first results this month
  1. Managed by your staff
  2. Monthly payment from
    USD 5,400 for the team of
    BI Developer + PM
  3. No need to hire & train developers
  4. 14 days stop / pause notice

TURNKEY BI & DATA PROJECTS DEVELOPMENT

We recommend starting from the “consulting” or “time & material” options for the Business Management Dashboards creation if you are a business with standard dashboard requirements. Implementation takes up to 3 months with minimal risk and responsibility for the outcome. Just leave your implementation request, select the system architecture design and get your offer.

GET COMPANY MANAGEMENT DASHBOARD

Cobit Solutions

More articles and cases

Why does my Company Need Business Intelligence?

21 Jan 2022

Why does my Company Need Business Intelligence?

We often have clients who have already heard about the Business Intelligence system and are interested in it, but don’t know the full detail ...

Read More
Power BI Dashboard vs Report

29 Aug 2022

Power BI Dashboard vs Report

If you manage the company or department, branch etc. you have faced some reports in your life. But what about dashboards? Have you seen thes ...

Read More
Accounts receivable dashboard: Keep an eye on them!

27 Oct 2021

Accounts receivable dashboard: Keep an eye on them!

When you ship your productcs, do you defer payment? Do you sell to any major chains? Are you sure they’ve paid for everything or do yo ...

Read More

KEY FIGURES OF THE COMPANY

457

dashboards created in 2022

150+

years of IT experience among employees

17

data experts & BI consultants

12B

USD annual revenue of clients that utilize our analytics solutions