Dashboard Consulting Services


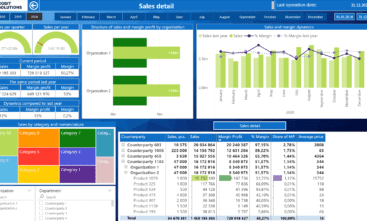
Find out which products bring the most profit.
Assess the situation in real time.
Get an understanding of how to work better with analytics.
for business intelligence succesfull implementation


We offer dashboard consulting services to help you transform disparate data into clear, structured analytics.

Strategic Vision for Informed Decisions
We help formulate business requests: product profitability, cost of customer acquisition, and channel efficiency. Then, we developm dashboards so managers can quickly see where action is needed.
Comprehensive and Insightful Reporting
We convert data sets from CRM, ERP, marketing and financial systems into reports with filters, segmentation, and comparisons. We explain trends in analytics.
Tailored Solutions for Efficiency
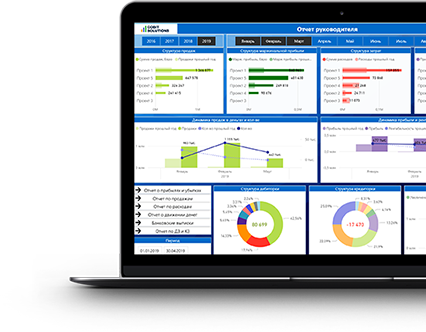
We build dashboards for roles: CEO, financiers, marketers, department heads, anyone who can benefit from data-driven decision-making. Each has its own KPIs, level of detail, and set of indicators. All data in one interface.
Expertise
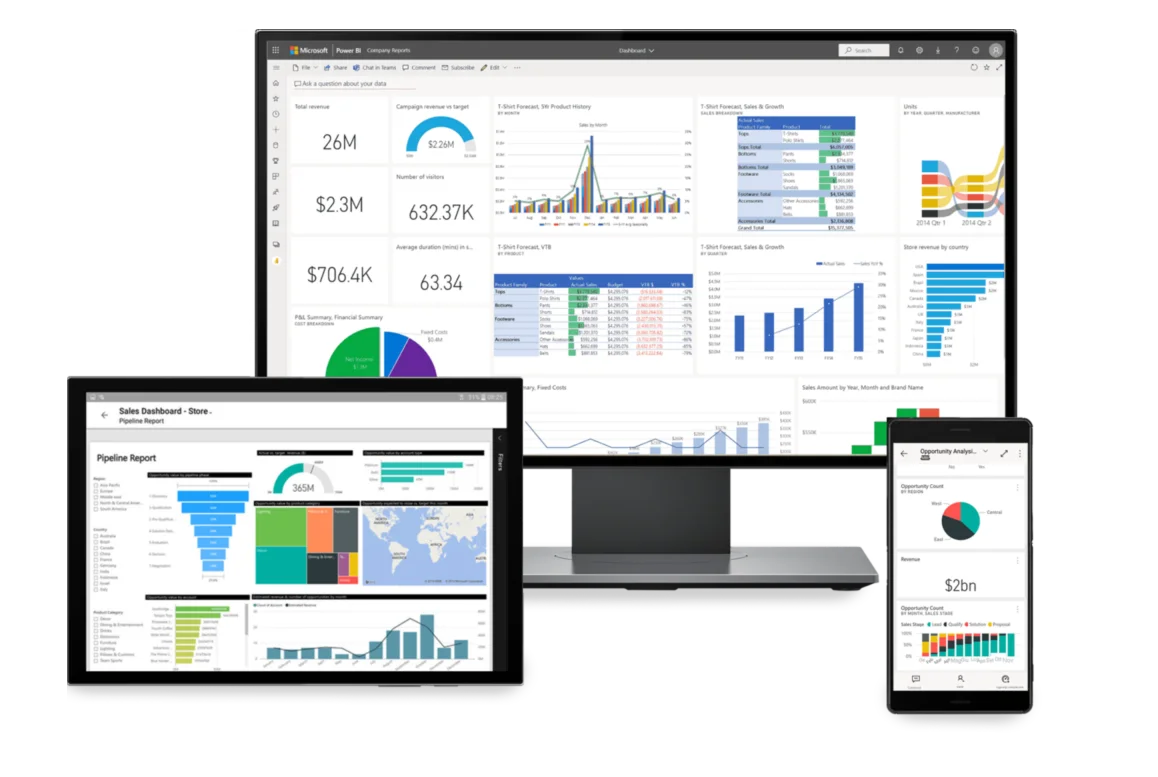
We work with Power BI, Tableau, Qlik, MicroStrategy and SQL solutions — we implement data models. We also build analytics based on DAX, SSAS, SSIS and optimize sources for visualization.
Trusted Guides
We conduct data audits, help with the selection of BI tools, describe the structure of dashboards, train and educate end-users, prepare documentation. You are not left alone with the technical solution.
Insightful Reports
We develop dashboards for sales, marketing, and finance departments. You get an interface that is clear to both the manager and analysts and other teams.


GET A FREE CONSULTATION
Let’s schedule a 30-minute online consultation so you can receive a solution built around your business needs.
Or text us via Messenger


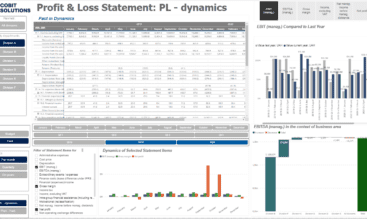
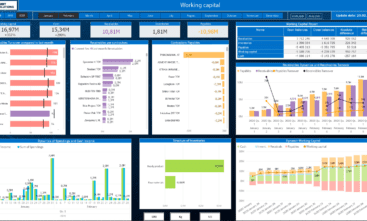
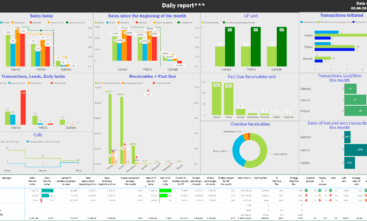
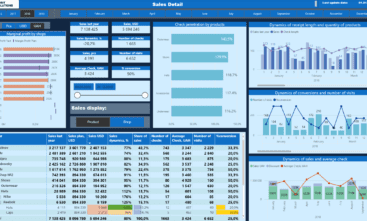
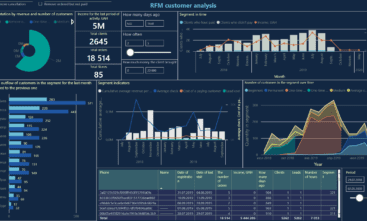
Examples of Dashboards