Home » Blog » Power BI Dashboard vs Report

Power BI Dashboard vs Report

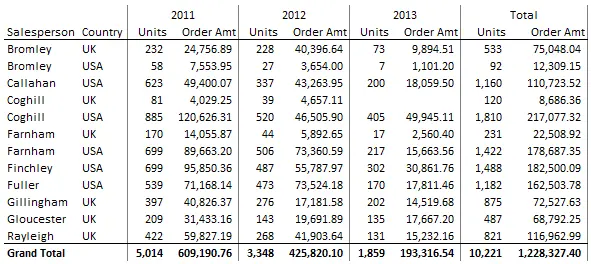
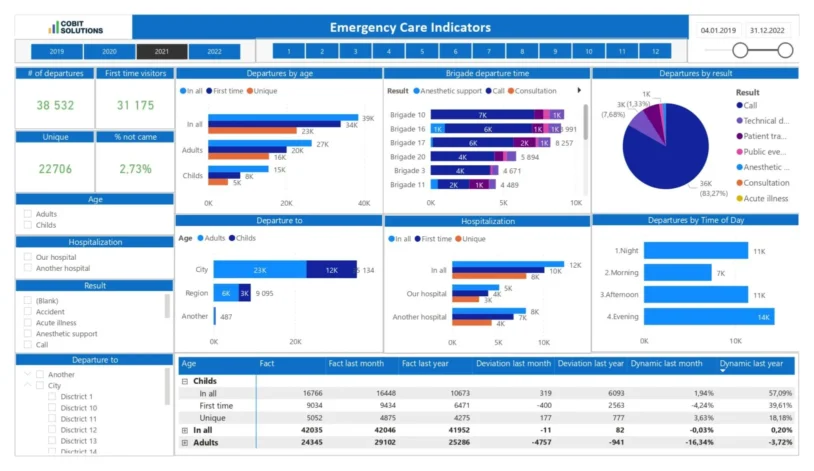
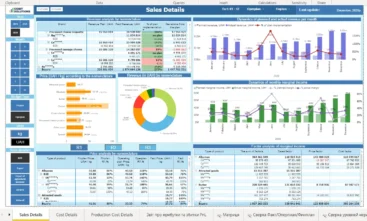
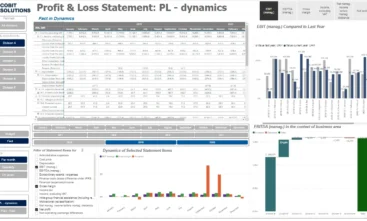
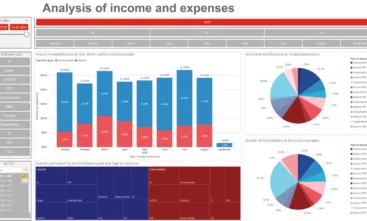
If you manage the company or department, branch etc. you have faced some reports in your life. But what about dashboards?

Have you seen these different types of reporting and tried the pros and cons of each technology? Let’s compare dashboards vs reports to clearly see the difference between them. The mutual purpose of both of these reporting options is to present the results of some work of the venture through periods of time.

Classical report

Business Intelligence dashboard

           However, the similarities end here. You can get the results in the long detailed form of report and one dashboard with deep penetration.

           The first huge Power BI difference between report and dashboard is in combining data in the endless lists of tables or calculating results into one “panel”. Inside this window or panel, the dashboard combines different figures in graphs, tables, pie-charts, diagrams and lists with the numerous options to fall into the different dates and segments.

            Report from its side shows all the detailed results in one aspect of work without analytic or visualization. Here is another distinguishing feature of  Power BI dashboards vs reportse

Detailed insight into dashboard

The work of the dashboard forms the Business Intelligence and calculation formulas which help you see the results of different business processes such as revenue analysis,  cashflow of business units, production efficiency, customers behavior and many other areas of analysis. Separately it could develop digital marketing analytics or other business interactive reporting for any industry.

        Classical table reports from their side can’t offer any complexity of results because they reflect the dates for one industry, or activity, department throughout the time period. Plus it can take a long time for you to read and analyze so many pages.

Before starting the dashboard development process each company or business discusses which data should be automatically updated to dashboards from  API, ERP, CRM, databases, Excel or any other  IT systems

Reports vs dashboards Power BI

          Reports vs dashboards take the data from endless Excel tables. Sometimes reports are prepared manually and it could take days or even months to form one report for a big corporation. Power BI dashboard vs report form the newly tailored and updated data panel, each time you look into the browser from your personal computer or phone. You don’t need to ask somebody to prepare it for you or recalculate it. 


          This way financial officers, general managers, decision makers, and vice-presidents get full control of the crucial business metrics and could affect the situation for better profits and KPIs maximization. Moreover one could create your own dashboard on the base of a developed business intelligence system for your company. It will take some time for education to master this option. In addition it will help the user to fall into the analytical and periodical dashboards to see the financial reporting info back and forth.


           It helps you to keep your finger on the pulse of the financial situation and see the whole picture on a daily basis. No doubt that adjustments made in time can save the companies from losses and forecasted sales drops. 

The advantages of interactive reporting Power BI online platform are as following:

  • Saving time and increasing business control,

  • Helps companies to maximize revenues and profits,

  • There’s no need to ask and wait for report,


  • Can be accessed from any devices anytime,

  • Analyze huge amounts of information quickly and precisely.

          On the other hand, reports collect the most profound information on a long-shirt document. Here you can observe all types of graphs, tables, and diagrams in one place. Thus, the analysis should be done by your own means and time.

          You can use the Cobit Solutions wide experience in Power Business Intelligence dashboards development for your businesses. We will not only  organize your work but save you time showing the capabilities of Power BI difference between report and dashboard. Our company creates interactive reporting and dashboards of any complexity which are integrated with data in all IT systems plus we specialize in the top analytics platform

Tip:

If you plan to implement Business Intelligence & interactive reporting it will cost you 40 minutes of online-meeting to discuss your objectives and get the proposal.

Conclusion

            Some people prefer the reports because of their detailed supply of tables, charts, and graphs with all the detailed one sector information. They do the full analysis themselves. The fans of the dashboards monitor the workflow and analyze any time they login into the system.  Reports and dashboards both serve the reporting data however it is presented in totally different fashions. The main difference between report vs dashboard Power BI is in fast analyses and online worldwide access any time. 

           A dashboard will facilitate your management work by a single view, while a report will collect all the details and dates together on endless pages. Prepare to put it all together and spend time on reading and understanding the results.

Read about our business intelligence for insurance case.

GET COMPANY MANAGEMENT DASHBOARD

Cobit Solutions

More articles and cases

Monthly Interactive Report to Manager – What’s the Best Way?

23 Feb 2022

Monthly Interactive Report to Manager – What’s the Best Way?

How many times have you prepared a monthly report to manager for a meeting, only to feel helpless three questions later? Scribbling notes &# ...

Read More
Why does my Company Need Business Intelligence?

21 Jan 2022

Why does my Company Need Business Intelligence?

We often have clients who have already heard about the Business Intelligence system and are interested in it, but don’t know the full detail ...

Read More
Business Intelligence in Retail to Converse Visitors Into Customers

21 Jan 2022

Business Intelligence in Retail to Converse Visitors Into Customers

The struggle of many retail chain managers is their inability to get timely access to statistics on profit margins and revenue for each indi ...

Read More

KEY FIGURES OF THE COMPANY

457

dashboards created in 2022

150+

years of IT experience among employees

17

data experts & BI consultants

12B

USD annual revenue of clients that utilize our analytics solutions