Lacoste, Helen Marlen, Sanahunt are some of our favorite retail clients.
The struggle of many retail chain managers is their inability to get timely access to statistics on profit margins and revenue for each individual store, product category, brand, or individual product. As a result, they have trouble with boosting retail sales.
Sharing Cobit Solutions’ insights together with Intalev in a webinar for retailers is an interesting experience. Let’s take a look at a case Business Intelligence in retail industry of a major retail chain.
Once a day, its CEO receives an Excel summary report outlining the chain’s total sales — yet it has no details or fine points.
HUMAN FACTOR
It takes three analysts to upload several 1C reports to Excel, and then collate and process the data in order to prepare the summary report for the CEO. Which means, the report is bound to have errors.
LACK OF VISUAL CLARITY
Tables that stretch for miles are difficult to understand and they provide no clarity. BI presents information in the form of graphs and diagrams, which make the problem areas immediately obvious.
WASTE OF TIME
A lot of employee time is spent on preparing such reports. In some cases, weeks can pass between the request and the report.
LACK OF DETAIL
Excel doesn’t allow for deep dives into details, all it shows is surface-level information.
WHAT DOES A MANAGER ANALYZE TO BOOST RETAIL SALES?
- CONVERSION OF VISITORS INTO CUSTOMERS
- AVERAGE PURCHASE VALUE, UNITS PER TRANSACTION, PENETRATION BY CATEGORY
- SALES, AND NOT JUST BY STORE, BUT ALSO BY SKU, PRODUCT GROUP, AND INDIVIDUAL EMPLOYEE
- CONTRIBUTION MARGIN, RATHER THAN TOTAL REVENUES
WE SET BUSINESS INTELLIGENCE IN RETAIL
Short answer: we solved the problem.
Long answer:
- Refined the existing 1C ledgers
- Imported data from 1C into the BI system via a special connector
- Created a data model in Power Business Intelligence in retail
- Made reconciliation dashboards for data control
- Introduced functionality for interactive report visualization
DOWNLOAD FREE CHECKLIST
of 25 recommendations for successful BI implementation


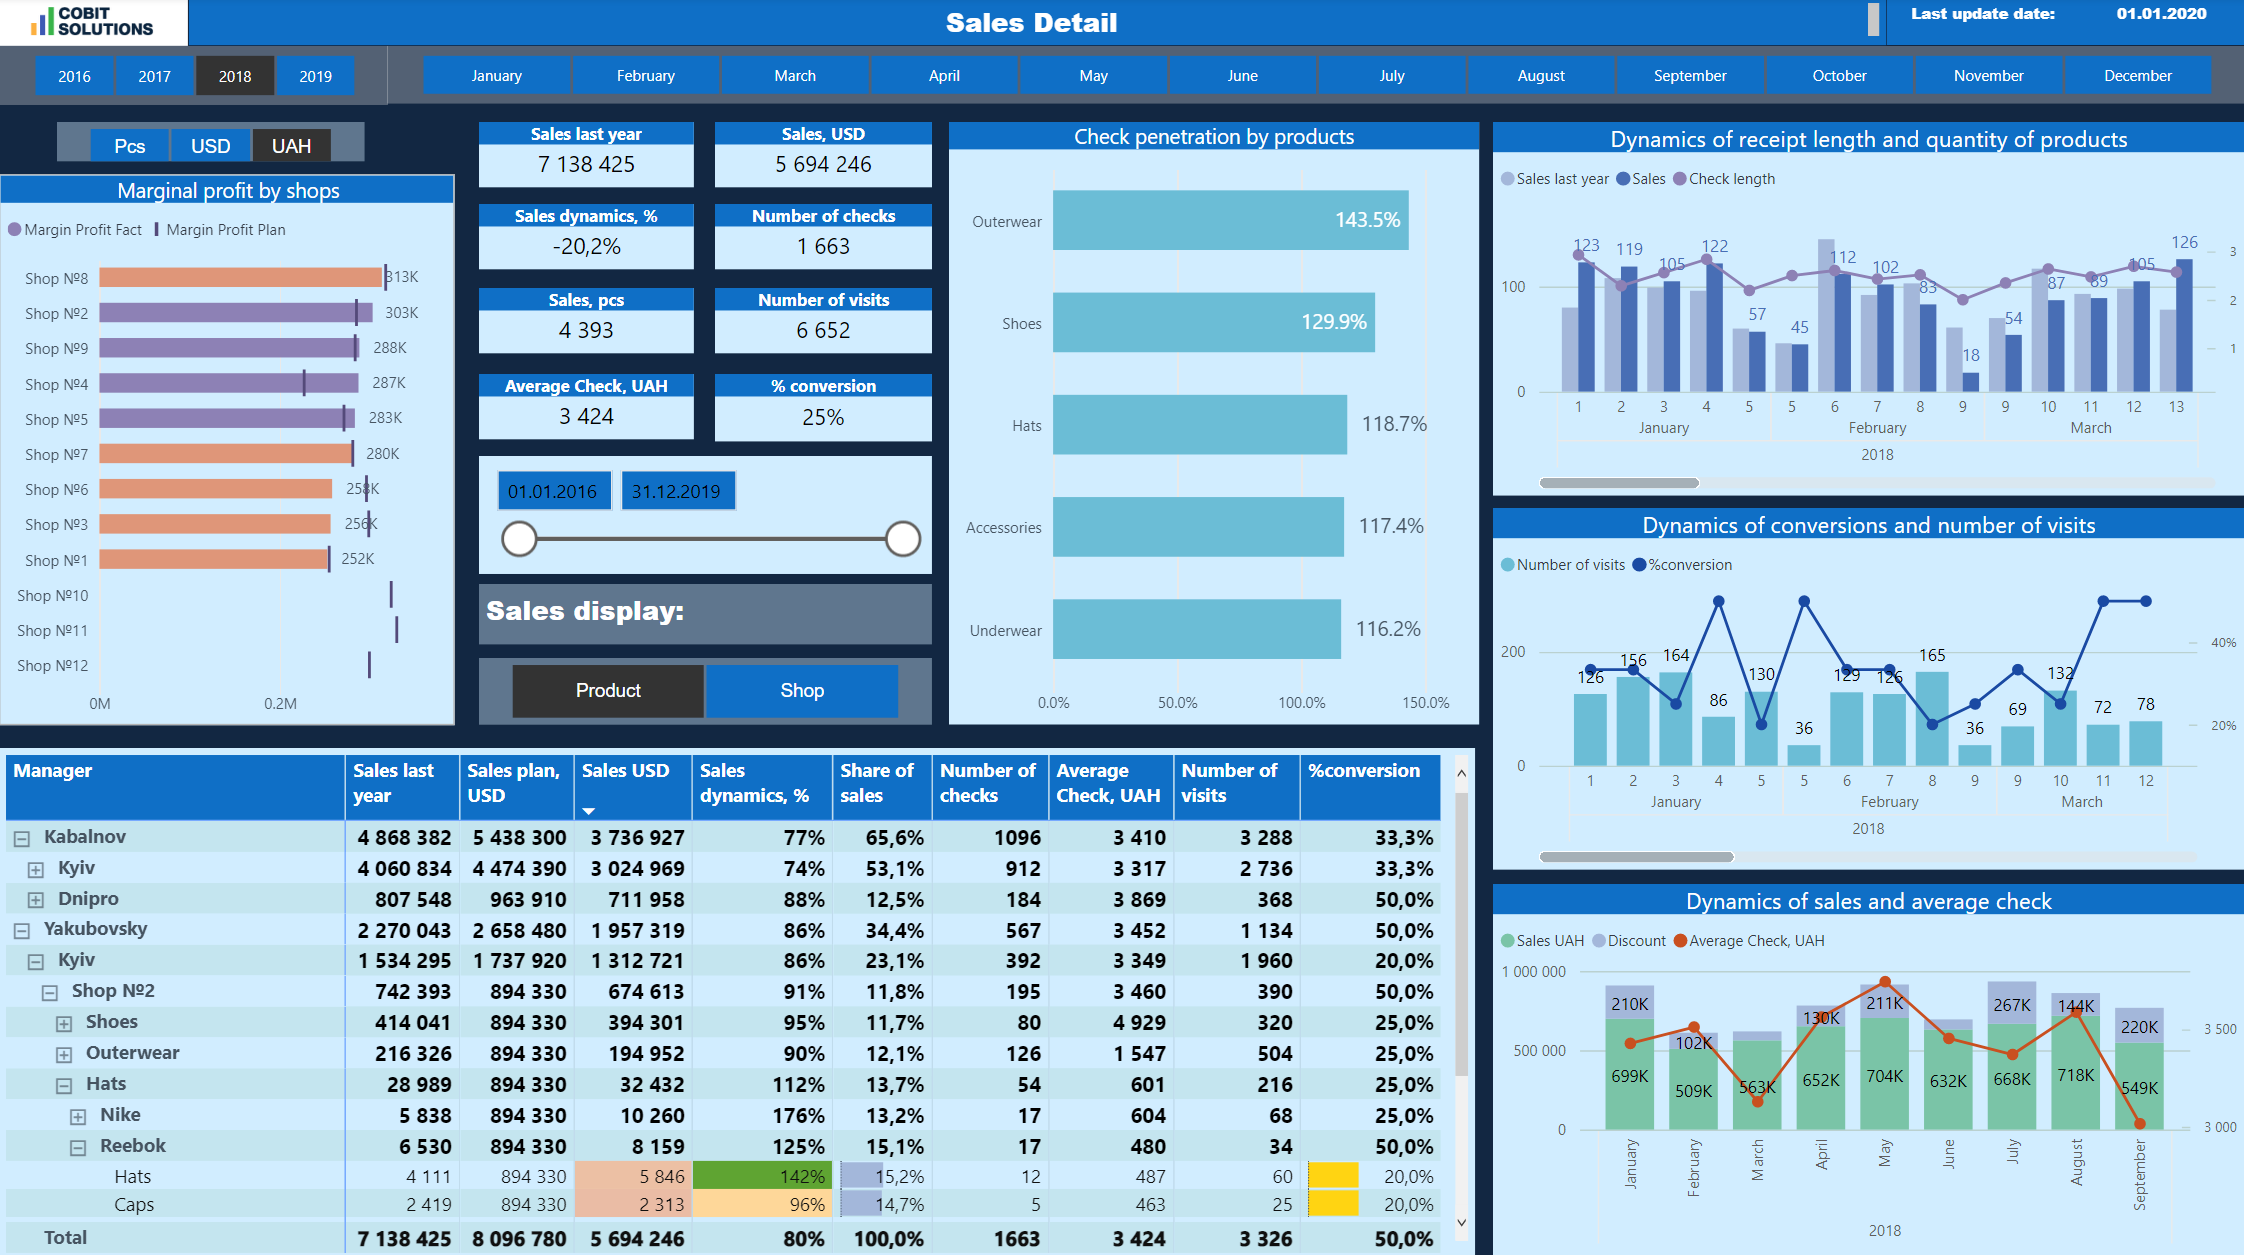
Look at the following two Business Intelligense in retail dashboards:
This shows the progress of the sales plan execution by store and brand, and allows to look up any detail, up to data on individual shop assistants, as well as average purchase value and conversion rate by store.
This provides a visual representation of year-on-year performance figures over a specified period, and can break the visualization down by various categories.
See also how track the main economic factors with BUSINESS INTELLIGENCE FOR INSURANCE

The CEO sees how individual stores, brands, product categories and subcategories, and shop assistants affect sales.
That means he or she can evaluate the performance of all shop assistants, regional managers, and category managers.
Let us know, what is your business or division’s biggest struggle?
The CEO sees how individual stores, brands, product categories and subcategories, and shop assistants affect sales.
That means he or she can evaluate the performance of all shop assistants, regional managers, and category managers.
Let us know, what is your business or division’s biggest struggle?
- You might also be interested in the article by the owner of Cobit Solutions WHY DOES MY COMPANY NEED BUSINESS INTELLIGENCE?
- Read more on real cases of BI system implementation in different industries on our BLOG
- BI solutions FOR SMALL BUSINES
BUT THE MAIN POINT OF THE ANALYTICS IS
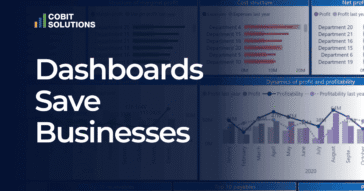
PROFIT GROWTH
Our dashboards give you a chance to control the revenue, cost price, margin, gross profiе and 47 other indicators on a daily basis. No need to wait for a monthly report.
Consistent control results in profit growth and business expansion.