A leading supplier of grains, fertilizers, and agricultural chemicals, Agropartner partnered with Cobit Solutions to enhance their sales analytics. What began as a simple data cube evolved into a complex, interactive Power BI solution, leveraging Agribusiness Business Intelligence to significantly improve the efficiency and decision-making of their sales team. With real-time corporate intelligence and dynamic data visualization, the system enabled operational efficiency and better strategic planning.
Agricultural Solutions: Sales & Efficiency with Agribusiness Business Intelligence
Agropartner is a prominent distributor in the agriculture industry, specializing in the sales of agrochemicals, plant protection products, fertilizers, and cereals. With a diverse product range and an extensive distribution network, Agropartner supports various types of agricultural businesses, making it one of the leading players in the sector. Their commitment to delivering high-quality agricultural inputs has cemented their position as a key player in driving growth and innovation across the agricultural supply chain.
Solving Agricultural Business Challenges through Advanced Data Solutions
Agropartner first approached Cobit Solutions to help their commercial department create a unified data cube enabling Excel-based analysis. But they soon saw that Excel’s shortcomings—such as processing vast amounts of data and the fixed character of reports—called for a stronger and more interactive answer. To improve their sales analytics, they required a mechanism capable of offering real-time data insights and supporting dynamic reporting.
Cobit Solutions proposed a comprehensive Power BI integration to address Agropartner’s needs:
- Data Integration: Connected to various data sources, including CRM, ERP systems, and Excel spreadsheets, to consolidate information.
- Data Model Creation: Developed a detailed data model within Power BI that allowed for complex calculations and reporting.
- Dashboard Development: Created interactive dashboards for various sales metrics, including performance indicators for sales managers, tracking calls, sales volumes, and client interactions. The dashboards were intended for tracking:
- Sales manager performance metrics.
- Weekly call volumes.
- Sales volumes and forecasts.
- Customer interactions and feedback.
- Financial health and utility expenses.
- Advanced Calculations: Implemented specific measures to handle complex calculations, leveraging ERP data for accurate and detailed analysis.
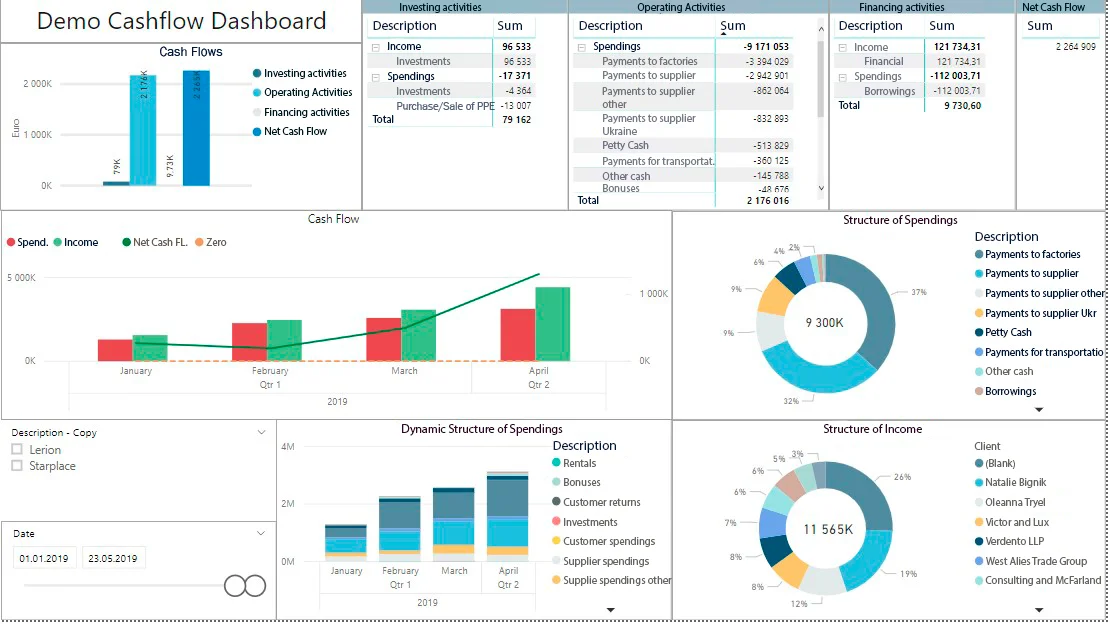
Cash Flow Dashboard:

Reach Out for Customized Power BI and Data Solutions
Are you ready to transform your business with Power BI and interactive analytics? Contact Cobit Solutions today to discover how our comprehensive business analysis can help you achieve real-time insights and operational efficiency. Fill out the form on our website, and one of our client managers will reach out to discuss your specific needs. Within 1-1.5 months, you’ll experience the benefits of dynamic dashboards tailored to your company, simplifying decision-making and boosting performance.
Developing the business becomes more comfortable when you regulate the workflows according to the fast reports with interactive analytics.
Dashboards creation

You might also be interested in the article by the owner of Cobit Solutions Why does my company need business intelligence?
Read more on real cases of BI system implementation in different industries on our Blog


