

DOWNLOAD FREE CHECKLIST
of 25 recommendations for successful BI implementation


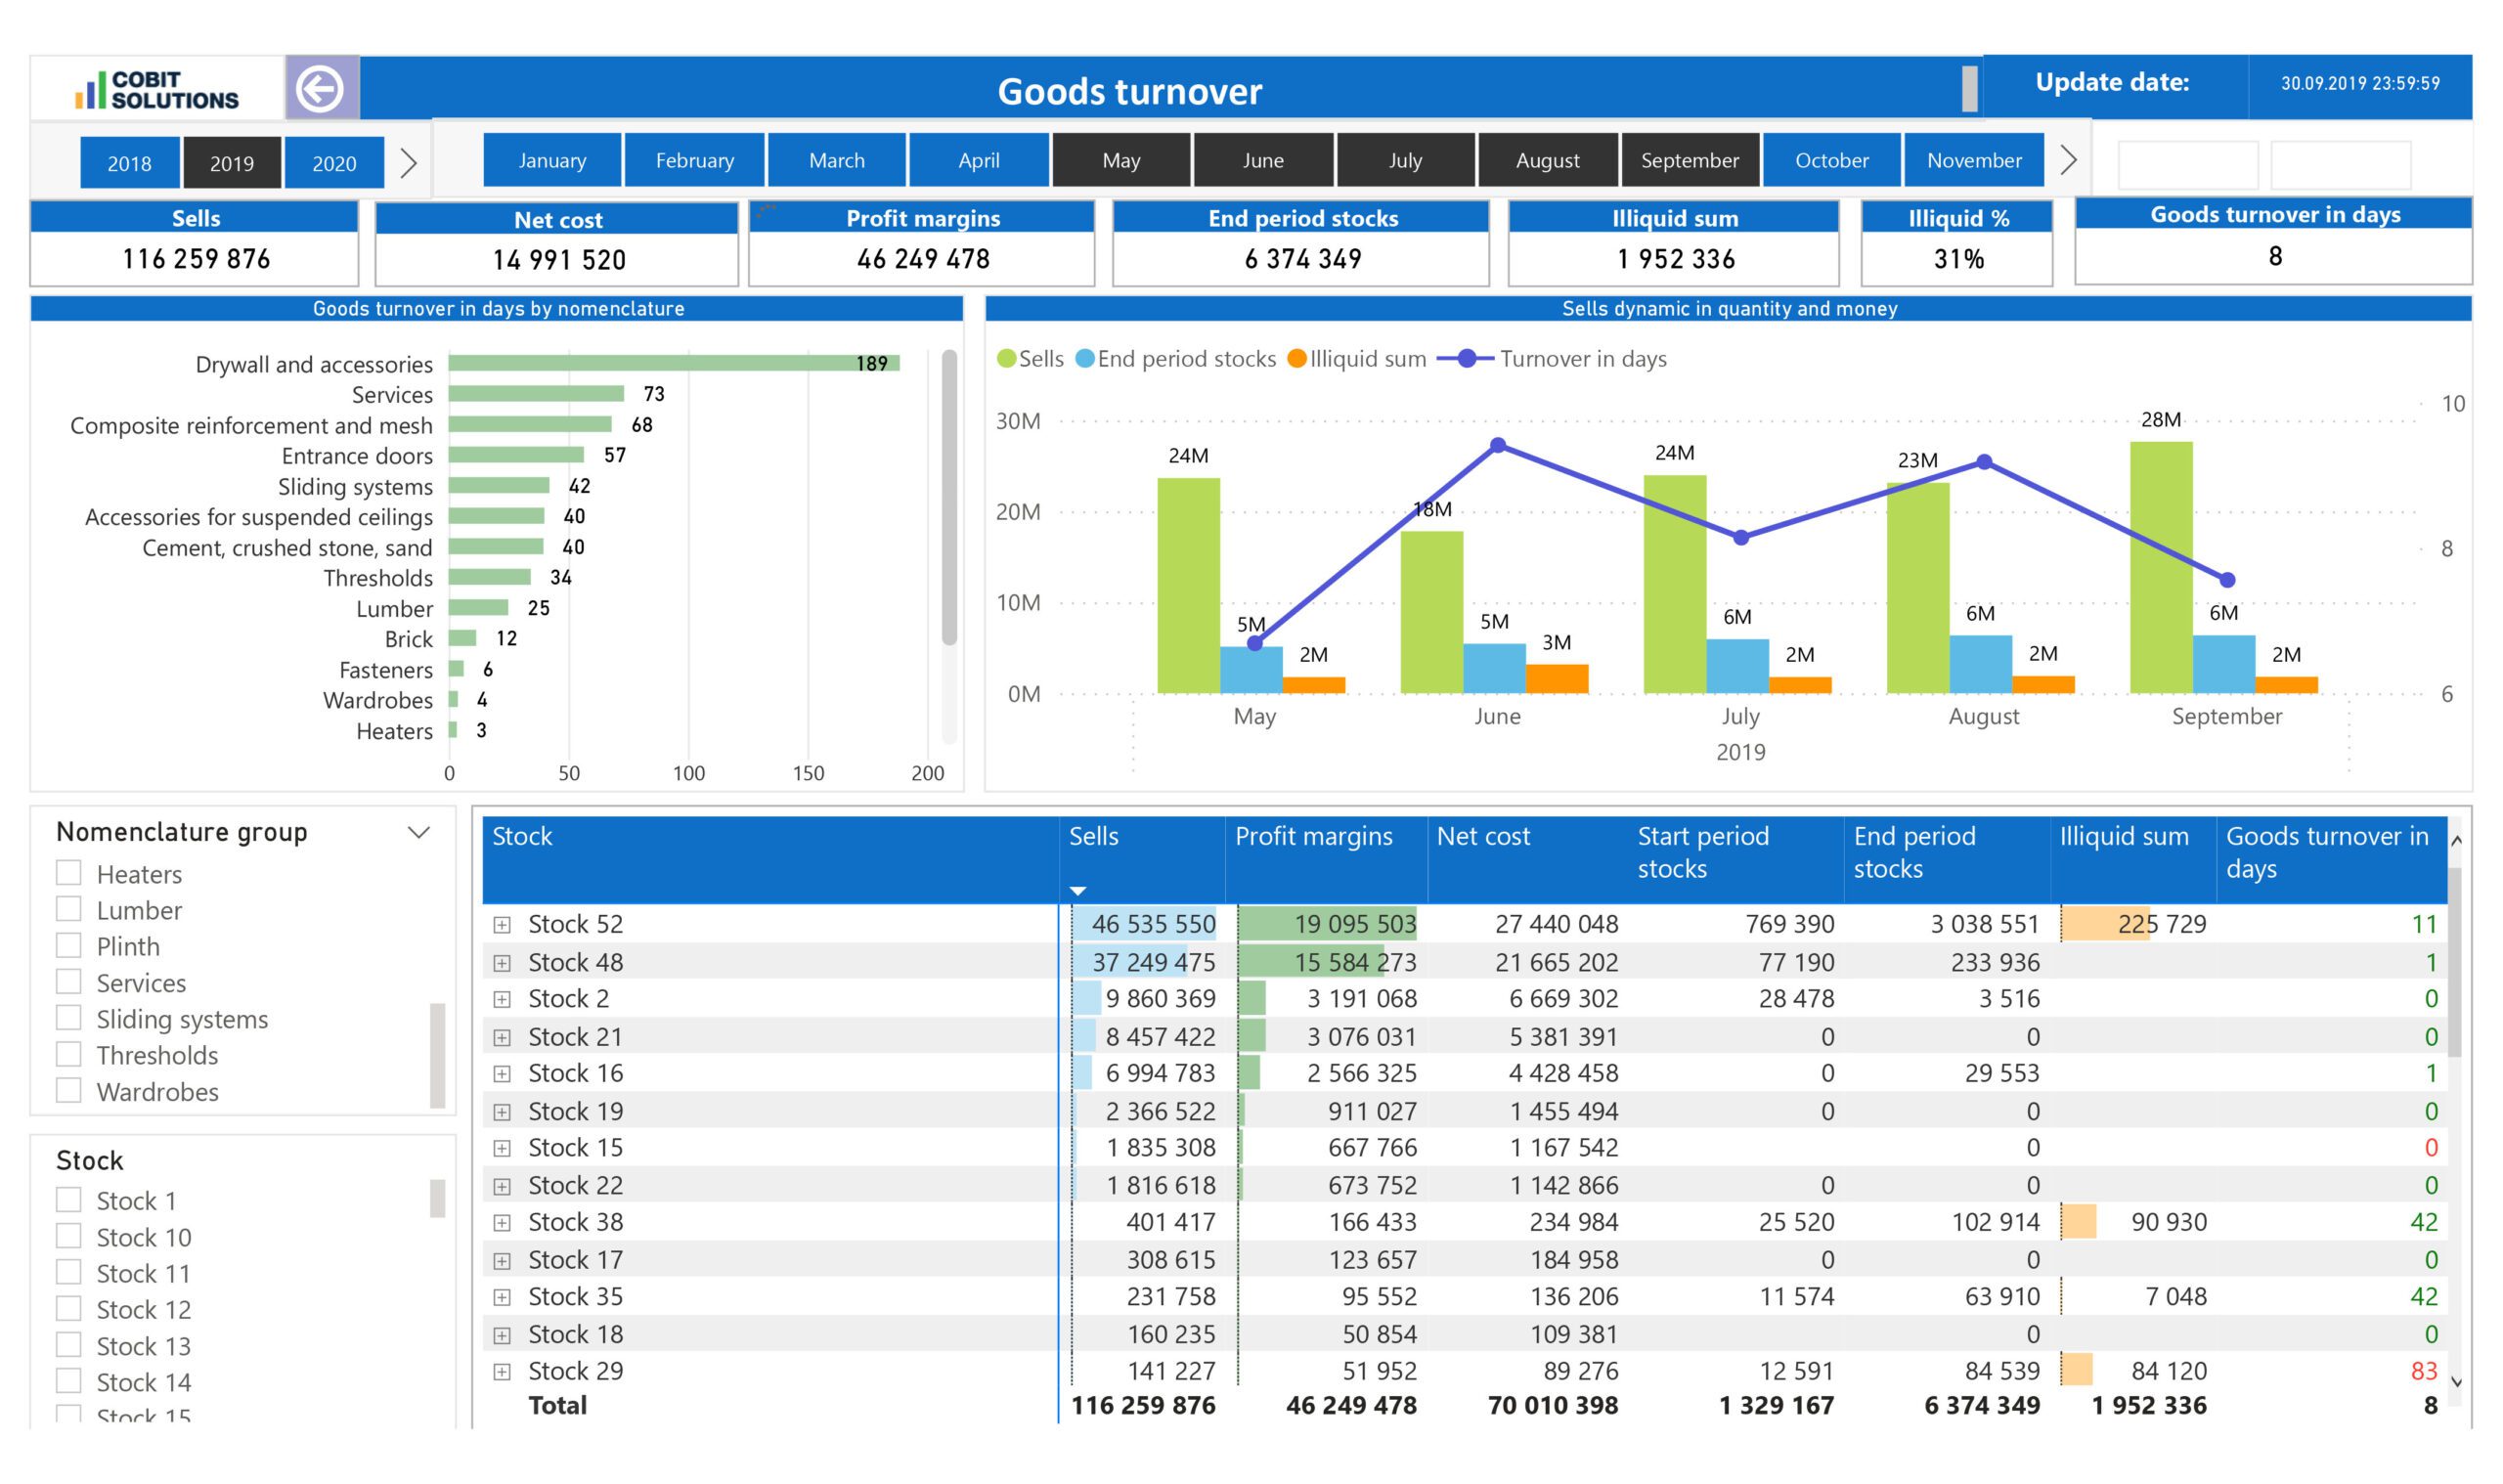
The struggle of many retail chain managers is their inability to get timely access to statistics on profit margins and revenue for each individual store, product category, brand, or individual product.
At Cobit Solutions we know just how to fix it by help of Business Intelligence in retail industry.
of 25 recommendations for successful BI implementation
Cobit Solutions commits to delivering a comprehensive, turnkey solution within four months

10 Sep 2024
Manufacturing Business Intelligence – Insights You Should HaveExplore how Cobit Solutions’ advanced analytics solutions and customized dashboards can help your manufacturing business achieve opera ...
Read More
21 Jan 2022
Why Would a CFO Need a BI System?Does a financial specialist need a CFO dashboard, and what specific tasks does a CFO solve with the aid of interactive reporting? ...
Read More
22 Aug 2024
Manufacturing Analytics: The Metrics You NeedLearn how leveraging data can enhance productivity, predict maintenance needs, optimize supply chains, and drive innovation. ...
Read More457
dashboards created in 2024150+
years of IT experience among employees20
data experts & BI consultants12B
USD annual revenue of clients that utilize our analytics solutions