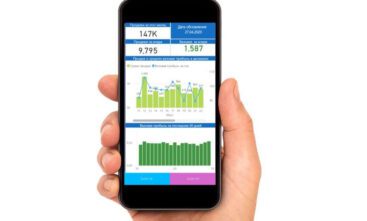
Have you lately found yourself buried with customer service data? From all angles, you are receiving reports, comments, and a lot of figures. But how then do you interpret all of it? How can you find out whether your staff is doing as expected or whether you need to make improvements? Power BI then comes in really handy.

What is Power BI, and How Might it Support
Customer Service?
Microsoft’s amazing business intelligence product, Power BI, enables you to organize all that voluminous data. In a matter of seconds, your data is transformed from overwhelming to simple-to-understand. All in one location, Power BI lets you monitor a broad spectrum of customer service indicators like response times, customer happiness, and team performance. Power BI transforms everything into simple charts, graphs, and reports that let you quickly grasp what’s happening rather than fixating on countless pages.
Power BI has the capability to provide you the insights you need to enhance your customer service, whether you are running a small customer service team or supervising a major business. Let’s explore how Power BI may transform your customer service strategy and increase team responsiveness and efficiency.

Real-Time Data Right at Your Fingertips
Consider yourself in command of a customer service staff. You have meetings, emails to respond to, and—of course—client handling on a full calendar. One of your items is suddenly drawing more complaints than normal. Typically, you would have to wait for the following weekly or monthly report to learn about this. With Power BI, however, you can view this data in real-time instead of waiting.
Real-time data relieves you of depending on out-of-date reports for decisions. Rather, Power BI provides you with up-to-date understanding of events. For instance, you oversee a staff and find that a product is drawing more complaints. Whether you assign more team members to handle the problem or notify consumers that help is on the way, Power BI’s real-time dashboard lets you rapidly notice the spike in issues and act to solve it. Real-time tracking of events helps you to get ahead of possible problems before they become more serious.
“Real-time analytics and data-driven decision-making is one of the top priorities for businesses aiming to improve their operations,” a Forbes article states. Real-time analytics ensures your team remains adaptable and sensitive to consumer wants, providing an advantage in customer service.

Simple Visuals for Improved Decision-Making
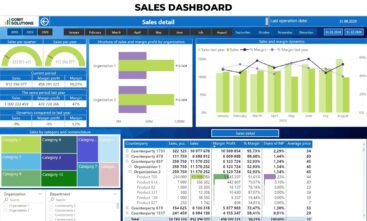
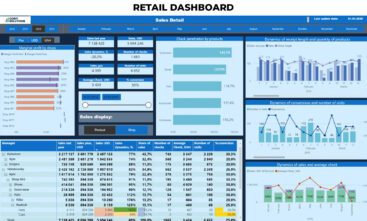
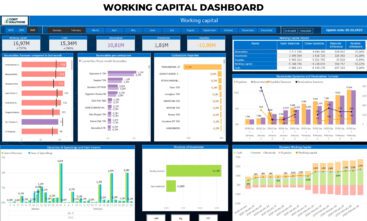
Measures of customer service can sometimes seem daunting. Raw data on response times, ticket statuses, satisfaction levels, and more might abound on your seemingly limitless spreadsheets. Raw data, however, can be difficult to understand, particularly in cases involving several dozen variables. That’s where the potent visualization tools of Power BI shine.
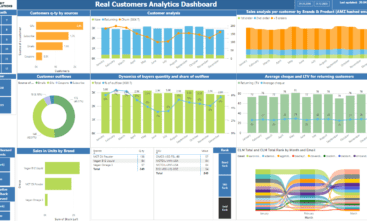
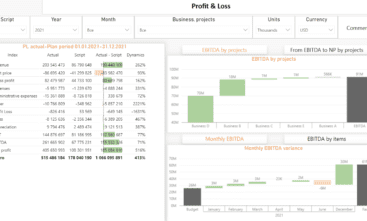
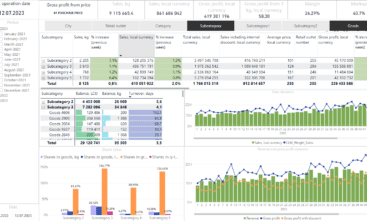
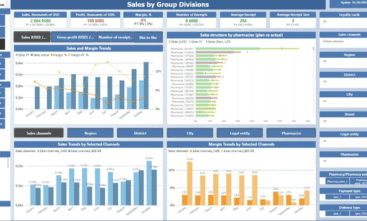
Power BI’s capacity to translate complicated data into straightforward, readable graphics is among its strongest strengths. Power BI shows everything as pie charts, bar graphs, line charts, and heat maps rather than browsing through protracted lists of figures. This allows you to rapidly understand key ideas without having to sort through countless data rows.
For example, Power BI can show you the general trend, the main elements influencing customer satisfaction, and any areas of concern by displaying the satisfaction score in a basic bar graph should you be interested in customer satisfaction for a given week. Likewise, you can use the average response time as a line chart showing the speed of resolution and any trends over time if you wish to monitor how fast your team is answering support tickets.
Harvard Business Review says, “Visualizing data helps businesses make faster and better decisions.” Power BI lets you confidently find patterns, track performance, and make data-driven decisions by turning your data into graphics.

Forecast Customer Service Trends Using Predictive Analytics in Power BI
Imagine if you could foresee customer service issues before they ever started. Imagine being able to budget your resources in queue for an increase in customer questions. With predictive analytics from Power BI, you can indeed accomplish just that.
Power BI can spot trends and patterns in past data that provide insight into future consumer behavior. Power BI can project when you might anticipate an increase in customer problems by examining prior interactions, including support tickets, comments, and complaints. For instance, Power BI can let you know if your business usually sees an increase in client questions following a significant sale or product launch and enable you to get ready for it.
Companies using predictive analytics are five times more likely to raise customer satisfaction and three times more likely to retain customers, according to a McKinsey & Company analysis. Power BI’s predictive features help you to make sure your staff is ready to meet demands in customer service before they ever arise.
Custom Dashboards Designed Specifically for Your Use
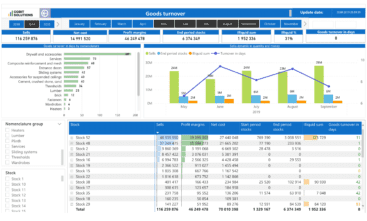
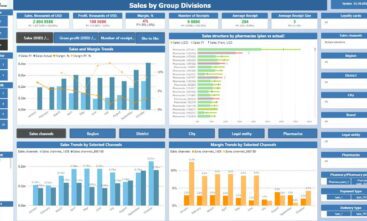
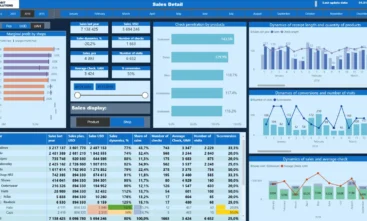
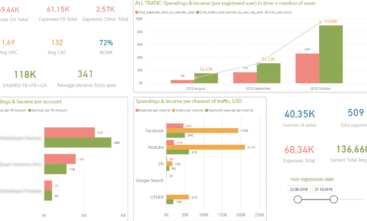
Power BI’s degree of customization is among its best features. Every company is unique, and so are its customer service requirements. Power BI lets you develop customized dashboards tracking the particular indicators most important to your company, therefore avoiding the need to accept a generic dashboard.
Assume for the moment that tracking response times and making sure your staff is rapidly addressing client problems takes first priority. Power BI lets you design a dashboard just for measures of average response time, time to resolution, and customer feedback ratings. Depending on company needs, you can even divide these benchmarks into several teams or areas.
Conversely, if your priorities are customer satisfaction and general attitude, Power BI may build a dashboard showing client comments, ratings of satisfaction, and Net Promoter Scores (NPS). Power BI will provide all the data you need in one location, shown in an understandable manner, thereby helping you to determine what is critical for your company.
“Customization is essential in the corporate environment of today,” advises top research and consultancy firm Gartner. “Being able to fit your analytics to your particular goals helps businesses to remain focused and get more value from their data.”
Use Power BI Insights to Boost Your Customer Service
Let’s examine some of the important revelations Power BI can offer for enhancing customer service:
Tracking Response Times
Tracking how long it takes for your staff to answer consumer questions can enable Power BI to provide you insight into areas needing work. Should you find that response times vary depending on particular days or for certain products, you can act to resolve these problems. If managing these issues becomes overwhelming, consider Outsourcing Customer Service to experts who can help streamline your processes and deliver quality support.
Monitoring Client Satisfaction
Monitoring client satisfaction ratings helps you to spot both what is and isn’t working. Should a given encounter or product release produce a decline in satisfaction, you can look into the reason and implement remedial action.
Analyzing Ticket Trends
Power BI can show you ticket numbers throughout time, enabling you to see trends and forecast when you will have more questions. Should there be a trend in the timing of customer complaints, you can prepare ahead and designate more resources to meet the higher demand.
Team Performance
Power BI lets you monitor team member individual performance. Are they satisfying consumers? Are there areas where some team members require more help or training?

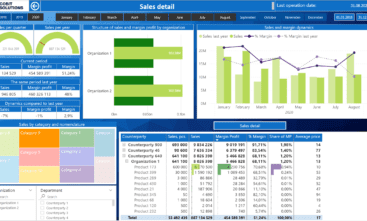


Tracking these important performance indicators (KPIs) enables Power BI to help you identify areas needing work, proactively handle client issues, and finally provide superior service.
Conclusion
Customer support teams must be able to make rapid, effective decisions grounded on correct facts in the fast-paced corporate environment of today. Power BI allows you to convert complicated customer service data into understandable, useful insights that enhance your performance and increase customer satisfaction.
Power BI has you covered whether you need real-time data, predictive analytics, or bespoke dashboards. And you can make sure you’re maximizing this potent tool by consulting professionals like Cobit Solutions.
What then do you need? Take control, make data-driven decisions, and improve your customer service right now to avoid letting your data overwhelm you!
Take advantage of modern digital data interpretation to instantly eliminate errors and maximize the potential of your business during a recession!


