Home » Blog » Profit and Loss Dashboard: Analyze Financial Performance and Profitability

Profit and Loss Dashboard: Analyze Financial Performance and Profitability

Get professional Profit and Loss Dashboards with Cobit Solutions’ experienced specialists who have implemented BI in dozens of industries. Optimize your financial performance and boost profitability!

Profit and loss dashboards are essential tools for businesses looking to assess their financial performance and make data-driven decisions. Companies across industries rely heavily on accurate financial analytics to monitor profitability, expenses, and revenue streams. With a variety of financial activities—such as sales forecasting, expense management, and revenue analysis—businesses need a clear view of their profit and loss metrics to ensure sustainable growth.

Before the rise of interactive dashboards, financial specialists had to sift through endless spreadsheets and juggle multiple software tools to gather insights. This manual process made it difficult to track profitability, compare expenses, and evaluate financial performance efficiently. Today, profit and loss dashboards have revolutionized the way businesses analyze financial data by unifying disparate data sources into a single, streamlined view. These dashboards provide real-time insights into key financial metrics, allowing businesses to make informed decisions and optimize profitability faster than ever before.

What is a Profit and Loss Dashboard?

A Profit and Loss (P&L) Dashboard is a powerful tool that provides a clear and comprehensive view of a company’s financial health. It visualizes critical financial metrics such as revenue, expenses, and net profit in an intuitive format, allowing businesses to monitor and analyze their performance in real time. Whether you’re a financial analyst, manager, or business owner, a P&L dashboard simplifies complex financial data for quick decision-making, offering an accessible snapshot of profitability.

Selected key performance metrics (KPIs) are equally crucial in a Profit and Loss (P&L) Dashboard for fast and informed decision-making. These KPIs help businesses monitor financial performance, assess profitability, and make timely adjustments to their operations. By tracking essential financial indicators such as revenue growth, profit margins, operating expenses, and net income, decision-makers can quickly evaluate whether financial strategies are effective and where adjustments are needed.

A P&L dashboard consolidates this critical financial data onto a single, easy-to-navigate page, providing valuable insights at a glance. It simplifies complex data sets into visually intuitive charts and graphs, making it easier for managers and executives to understand key financial trends. The ability to visualize this information helps in forecasting financial outcomes, identifying areas where cost-saving measures can be applied, and adjusting resource allocation for maximum profitability.


The metrics in Profit and Loss reporting dashboard may include:

See more Sales Dashboard examples to fit your needs and identify spending trends as well as top and bottom-performing products across each financial segment.

What does the Profit and Loss dashboard show and what is it for?

The purpose of a Profit and Loss (P&L) Dashboard is to visualize the most relevant financial metrics, helping businesses track their progress toward strategic financial goals. To select the most effective KPIs for a P&L report, financial managers and stakeholders need to analyze their impact and filter out the most critical ones for monitoring profitability and financial health.

The Profit and Loss (P&L) Dashboard typically consolidates data from various departments, revenue streams, and expense categories to provide a comprehensive view of financial trends and patterns across different business units and regions. This interactive analytical tool allows users to analyze profitability metrics at both the overall and detailed levels, helping businesses understand revenue performance, cost distribution, and profit margins across all operations.

 Key dimensions for analysis could include:

General types of analyzes are not just the fact, but comparison of fact and last year, fact and plan, fact and last month, fact and deviations.


Cobit Solutions' Clutch Review:

Number of Reviews

16

Project Cost Range

$

10.000

to

49.000

Average Referral Rating

5/

5

What are the target roles and dashboard users?

Generally, all key decision-makers in the company need to monitor and control the financial workflow to ensure the business stays on track. In the context of a Profit and Loss (P&L) Dashboard, the target roles and users within the organization include:

Profit and Loss Dashboard Dashboard

The work of the dashboard forms the Business Intelligence and calculation formulas which help you see the results of different business processes such as revenue analysis,  cashflow of business units, production efficiency, customers behavior and many other areas of analysis” – says Dmytro Chashnyk, CEO of Cobit Solutions, Expert in IT with 19 years of experience, 10 years on CIO/CTO positions.

Other types of Marketing Dashboard:

[:en]other-types[:]

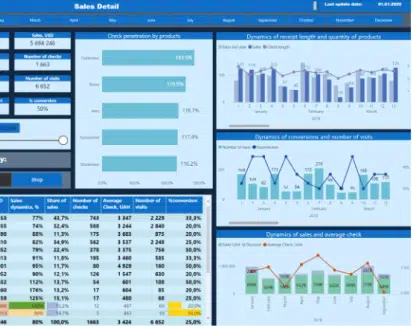
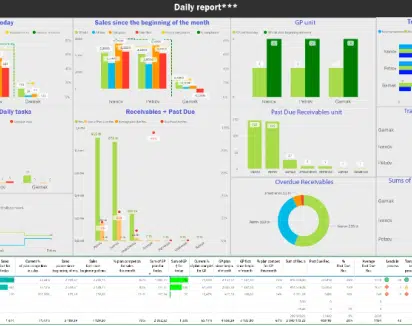
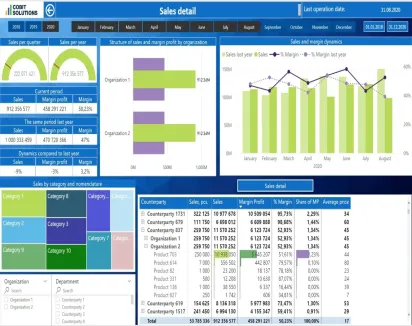
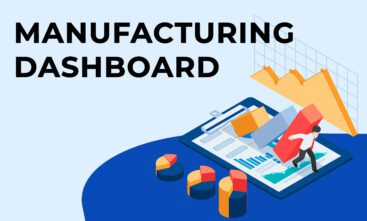
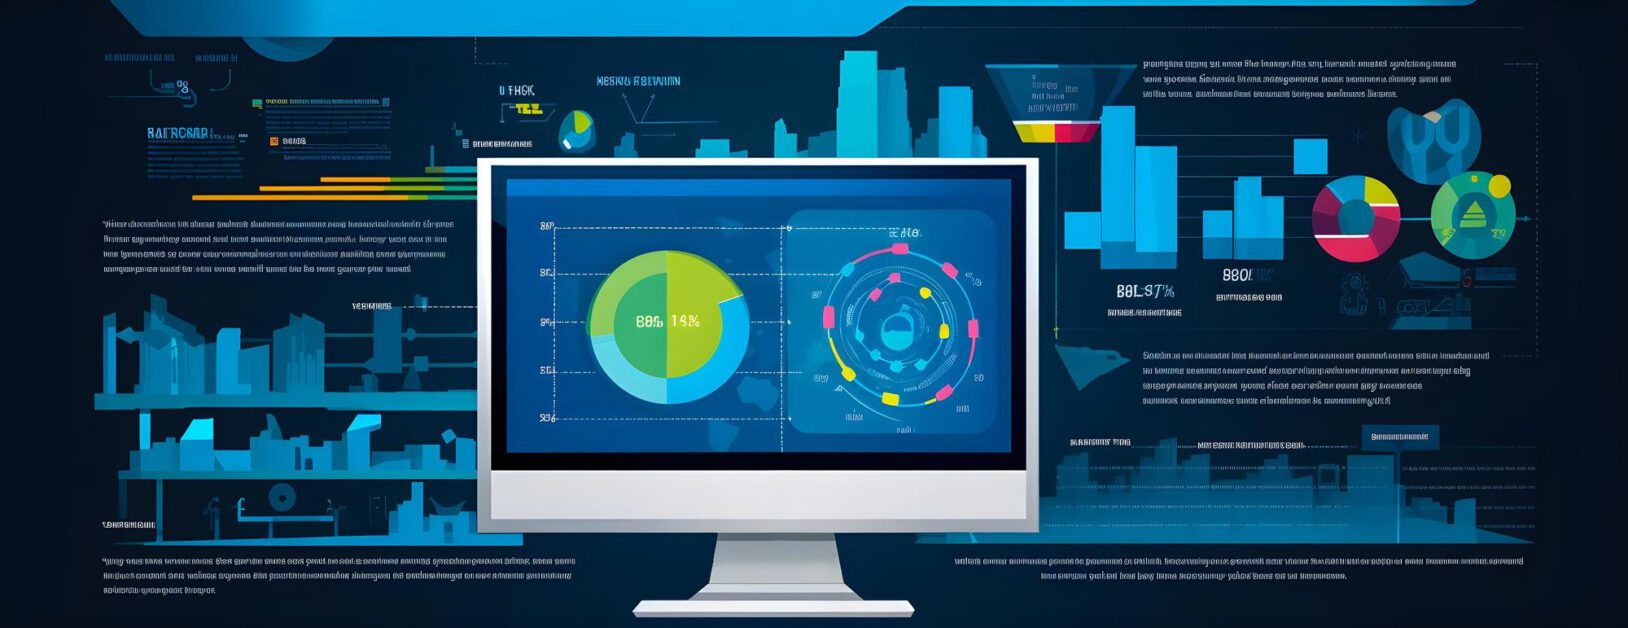
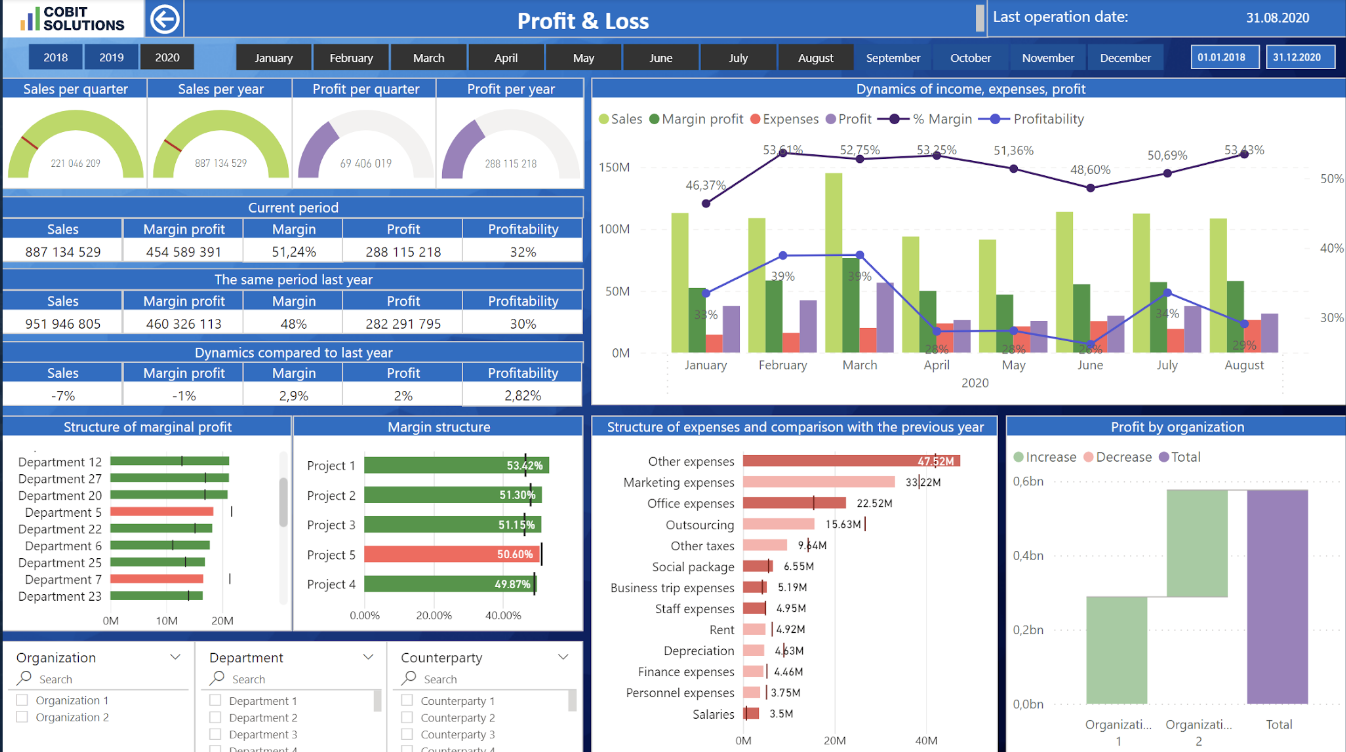
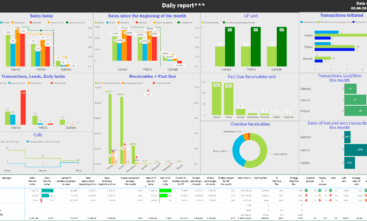
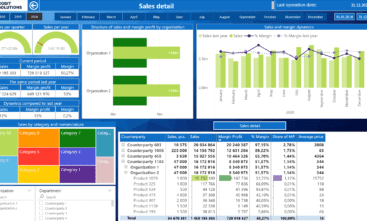
PROFIT AND LOSS DASHBOARD VARIATIONS

Our Power BI consultants will develop tailor made dashboards that will help effectively control sales

Salesforce Dashboard

Salesforce Dashboard

CRM Sales Department Daily Report

Sales Dashboard

Sales Dashboard

Margin and revenue factors analytics

Marketing dashboard

Marketing dashboard

RFM customers database segmentation analysis

OUR Power BI consultancy benefits

  • Leveraging best practices:
  • Saving your time and money
  • Power BI and data technology experts  implementing turn-key data solutions
  • Delivering customized dashboards crafted for your organization's needs
  • 20-30% less expensive than hiring a local FTE.
Cobit Solutions

Power BI, ETL, DWH Development:

[:en]stars[:]
Quality
5.0/5
Schedule
5.0/5
Cost
5.0/5
Willing to Reffer
5.0/5

Turn-key BI implementation services:

ETL Data
Integration

[:en]File_Code[:]

Get the turnkey ETL data integration services for ERP, API, CRM, DB, Excel and any other IPs

BI Dashboard
Development

[:en]Note_Search[:]

Build custom dashboards tailored to business needs, including front-end interfaces and core back-end technologies

Platform and
Infrastructure

[:en]Processor[:]

Transforming your data silos into high-end decision-making tools on the Power BI platform for daily updated reports.

AI/ML and
Data Science

[:en]Select_Multiple[:]

Implementing AI/ML and data science options into interactive analytics solutions that help organizations increase revenue and margins

What's Your Stack?

Our development services already power over 150 active engagements. We typically land our teams within 2 weeks, so you can start shipping top-quality software, fast.

GET COMPANY MANAGEMENT DASHBOARD

Cobit Solutions

More articles and cases

Manufacturing Dashboard tracks the real state and goals achievement

29 Dec 2023

Manufacturing Dashboard tracks the real state and goals achievement

Measure the performance and success with manufacturing dashboards! Get a real picture of your key performance indicators, sales, gross margi ...

Read More
Benefits and Importance of Data Analytics in Manufacturing

06 Aug 2024

Benefits and Importance of Data Analytics in Manufacturing

Using the Power BI tools cutting-edge services, companies can unlock the full potential of their manufacturing operations and embrace the fu ...

Read More
Business Intelligence and BI Integration Services

15 Mar 2024

Business Intelligence and BI Integration Services

Cobit Solutions is a data analytics and business intelligence company that specializes in Power BI, Azure, SSIS, SSAS, AI/ML, ETL, and DWH. ...

Read More

KEY FIGURES OF THE COMPANY

457

dashboards created in 2022

150+

years of IT experience among employees

17

data experts & BI consultants

12B

USD annual revenue of clients that utilize our analytics solutions