AN ACCOUNTING SYSTEM VS DATA CONSOLIDATION
ERP is first of all an accounting system. It is about bookkeeping and tax accounting, warehouse, managerial, and cash accounting. Any types of accounting. All reports are generated only from the data contained in the ERP system itself.
Power BI is an online service intended for data consolidation from all accounting systems in one platform, which includes from 2 different ERP systems.
What systems do we consolidate data from on out clients’ requests most often? Excel, ERP, SAP, CRM systems, and any others. We also automate data collection from websites.
TABULATED VS VISUAL
For most non-specialists and business owners, ERP is a mere collection of numbers in table columns. Consequently, the data isn’t illustrative. It’s difficult to make managerial decisions based on it.
Power BI contributes to making mathematically sound decisions. The business’s data is clearly visible.
Interactive dashboards facilitate highlighting the factors that have an impact on the change of indicators. At the same time, they make it possible to see a negative trend and to make a decision at the stage when the problem is arising.
According to a poll by Qlik, this is exactly what stirs up the entrepreneurs’ interest in Power BI
STATIC VS INTERACTIVE
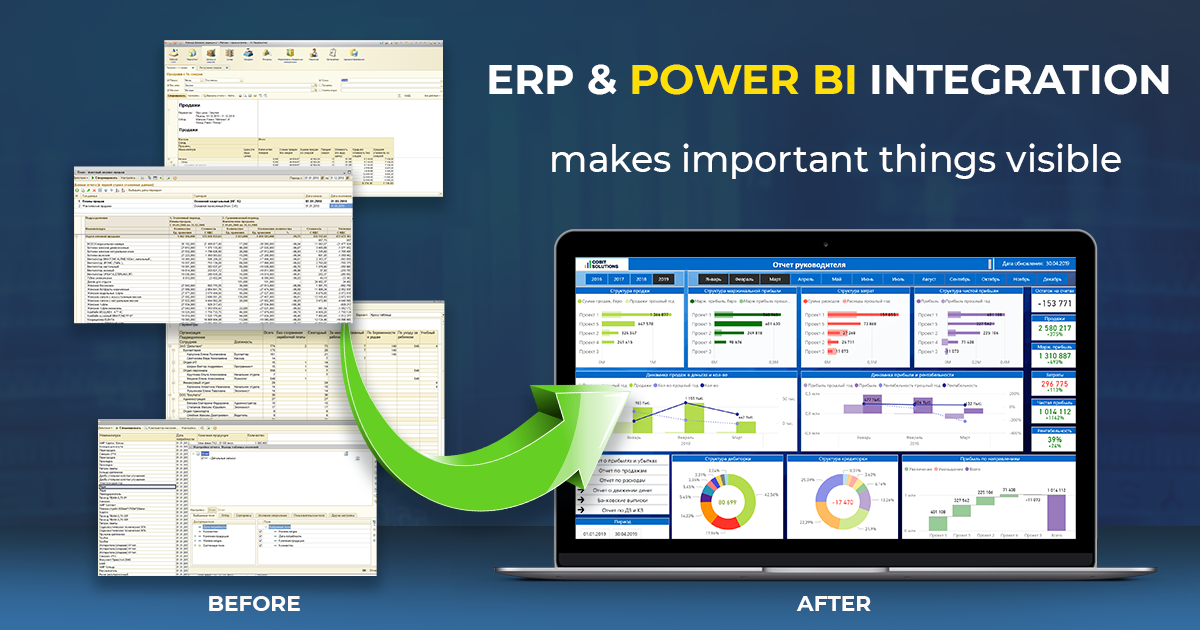
ERP displays static data in the form of multi-page illegible reports. Each new section of the report has to be filtered and downloaded separately, taking up the employees’ and managers’ time.
A BI system allows for online filtering and analyzing all the business indicators in dynamics: profit, sales, brands, projects, individual SKUs, problem areas.
What can be controlled online, for example, in sales and retail?
- which stores make the most sales;
- the most marginal goods, brands;
- the dynamics for every goods, department, store, salesperson;
- whether the sales plan is fulfilled and how many %;
- display the top sales managers for a certain period.
STATIONARY ACCESS VS FREEDOM
To use ERP, you must purchase a license and install specialized applications. Or you can examine huge reports in Excel prepared by the analysts. Mobility and demonstrativeness of such reports are out of the question.
To use a BI system, you needn’t install any additional program. Interactive reports can be viewed from any place of the world, from the cloud, from any type of device, even from a smartphone. All you need is Internet access.
A business owner needn’t install ERP at all but can control all the consolidated data at once in the BI system. Thus, the managerial accounting and the work of the whole financial department can be controlled on visual dashboards.
Read how to track the main economic factors with BUSINESS INTELLIGENCE FOR INSURANCE
DOWNLOAD FREE CHECKLIST
of 25 recommendations for successful BI implementation


MANUAL LABOR VS AUTOMATION
The process of report preparation in ERP looks something like this: the data is entered, the data is downloaded, report generation in Excel begins, the report is sent to the manager, but a wrong analytical section was used, and the process is started again. Normally, there are 2+ specialists at the company who are responsible for data downloading and report generation.
In a BI system, we configure automation of all data. The data in interactive dashboards is updated automatically every 1-2 hours. The owner and the top manager can see the current information that was entered into ERP and all the other accounting systems without the need to involve any additional employees.
What does a BI system help automate additionally?
- keep track of the whole business process scheme and identify its vulnerabilities, look for possibilities to improve the business process;
- set up automated alerts for the achievement of certain indicators: the KPIs, decline of profits below normal, etc.
Successful cases of Power BI implementation
- BI IN THE POWER INDUSTRY: WHAT TO CONTROL ON A DAY-TO-DAY BASIS?
- CONVERSION OF VISITS INTO PURCHASES. WHY DOES THE RETAIL SECTOR NEED BI ANALYTICS?
BUT THE MAIN POINT OF THE ANALYTICS IS
PROFIT GROWTH
Our dashboards give you a chance to control the revenue, cost price, margin, gross profiе and 47 other indicators on a daily basis. No need to wait for a monthly report.
Consistent control results in profit growth and business expansion.