If you’re wondering how to prepare your business for a recession, you’re not alone. Economists and nearly 80% of business owners agree that the likelihood of a recession in 2025 is high. Indications of an impending downturn are also reflected in the Federal Reserve’s gradual adjustment of interest rates to combat inflation, as reported by Bloomberg. The official declaration of a recession may come from the National Bureau of Economic Research (NBER), but months can pass before such an announcement is made. During this time, businesses may already be feeling the effects of a slowing economy, including rising unemployment, declining revenues, and scaled-back production.

This news may be unsettling, especially as many companies are still recovering from the disruptions caused by the COVID-19 pandemic. However, evidence suggests that businesses can thrive in any economic environment by optimizing key processes. Economic cycles of growth and contraction are inevitable, so adaptability is essential. To help you prepare, we’ve identified 65 Key Performance Indicators (KPIs) across 15 critical areas for analyzing your business’s resilience. Use this framework to assess your readiness for potential challenges and secure your company’s success — even in turbulent times.
By leveraging these KPIs, businesses can identify vulnerabilities, streamline operations, and capitalize on opportunities, ensuring they are well-prepared to withstand the impacts of a recession and emerge stronger in its aftermath.
Contents of the article:
15 Data Analytics Approaches for Business Sustainability
Whether you’re a seasoned entrepreneur or navigating your first major economic challenge, this guide will empower you to make informed decisions and transform uncertainty into strategic advantage. Don’t wait for the official headlines—start preparing today and secure your company’s success, no matter what the future holds.

1. Inventory Management Optimization
Companies engaged in retail, manufacturing, logistics, or warehousing can better navigate a crisis if they maintain optimal inventory levels. Excess stock negatively affects inventory turnover, while shortages impact customer satisfaction, which is critical for stable demand. Improving inventory turnover and increasing gross profit are key objectives that can be achieved with a well-thought-out inventory management system. To achieve these goals, it is important to monitor the following KPIs:
1.1. Days Sales of Inventory (DSI)
This metric helps track the most liquid products. For example, imagine you have 100 items that sell in two months. Another firm’s 100 items might sell in ten months. Meanwhile, 50 products from a third brand sell in just ten days. Finally, there might be a significant amount of inventory that sells so rarely it becomes obsolete. Having a clear picture of this helps make better purchasing decisions and understand how to increase inventory turnover.
1.2. Stockout Rate
This metric identifies actual sales losses caused by insufficient inventory. For example, if there were 80 items in stock but customers demanded 100, the potential loss of profit would be expressed as a percentage — in this case, 20%.
1.3. Dead Stock Percentage
This metric indicates the proportion of products that do not sell over a specific period. It can signal issues with the product assortment, demand, or marketing strategies that need to be addressed to reduce losses and calculate cost savings.
1.4. Carrying Cost of Inventory
This metric includes the costs of storing inventory, such as warehouse rent, insurance, and maintenance. It helps determine how long inventory should be held or the financial impact of holding it.
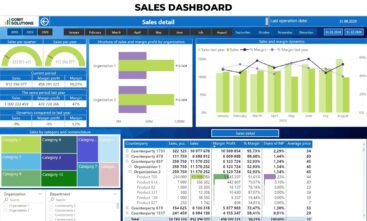
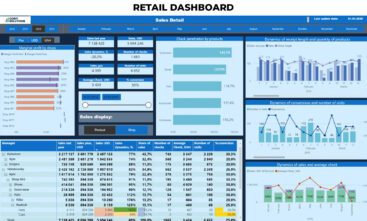
By tracking these metrics, you can identify ways to improve inventory turnover. For example, determine which products need to be produced or purchased in greater quantities and which should be sold off more quickly. If certain items are not selling, assess the effectiveness of your marketing efforts and adjust your strategy. Ultimately, optimizing warehouse processes helps reduce costs and increase business profitability during a recession.

2. Supply Chain Optimization
It’s no secret that timely product delivery directly affects trust-based relationships with customers. Therefore, companies involved in e-commerce, logistics, and distribution are interested in monitoring delivery efficiency. Customers expect goods to be delivered at the agreed time, in the required quantity, at an affordable price, and without defects. Wholesale buyers will select the best suppliers based on the following KPIs:
2.1. On-Time Delivery Rate
Of course, every production process faces unforeseen circumstances, so some percentage of delivery delays is inevitable. However, it is desirable to minimize this indicator. It is important to understand that if a company ships goods late, it loses its rating in the eyes of customers. This metric is also directly related to the Stockout Rate — that is, the loss of sales due to products being unavailable in stock. Wholesale buyers can track which suppliers most often delay deliveries and select the best ones based on this metric.
2.2. Lead Time Variance
This metric shows the difference between the expected and actual time for product delivery or order fulfillment. It can also be used to easily rank suppliers by identifying who delivers products on time more frequently and who delays. This allows businesses to choose the most reliable partners and avoid lost sales.
2.3. Freight Cost per Unit
This indicator helps assess how transportation costs impact the overall price of a product. By analyzing business expenses, it is possible to determine whether a company can afford delivery from another region or if similar products can be sourced closer.
2.4. Supplier Defect Rate
Retail businesses often source products from multiple distributors, each with different storage conditions. As a result, some suppliers’ products may spoil faster, leading to a higher defect rate. Tracking supplier ratings helps identify which partners are the best to work with.
2.5. Order Fulfillment Cycle Time
This metric measures the time from when an order is placed to when it is delivered to the customer. The shorter this cycle, the higher the company’s rating in the eyes of its customers. After all, buyers choose stores based on delivery speed.
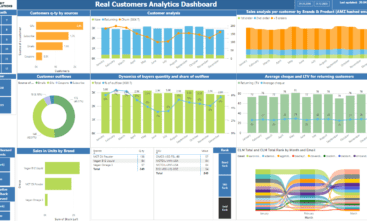
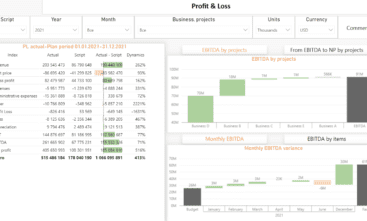
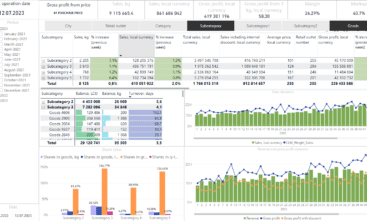
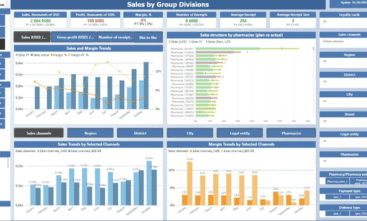
By monitoring the suggested metrics, answering the question of how to mitigate the effects of a recession becomes much easier. For instance, it stands to reason that businesses capable of processing orders faster and maintaining adequate stock levels of necessary products will stay one step ahead of their competitors.

3. Workforce Management Efficiency
Quite often, when a company’s growth suddenly halts, the question of workforce optimization arises as a way to reduce business costs. During a crisis, every employee must work with heightened efficiency, dedicating all allotted time to profit-generating tasks. A key business strategy during a recession is to maintain employee morale, ensuring they understand the importance of their contributions while avoiding burnout or turnover.
Replacing employees is significantly more costly for companies, as new hires require training and are less productive during the onboarding phase compared to experienced staff. Consequently, the more effectively a company manages its workforce, the fewer unnecessary expenses it incurs. The following metrics can help monitor this process:
3.1. Employee Utilization Rate
Each employee has tasks that either directly or indirectly impact the company’s profitability. For example, an employee might not only work on commercial projects but also spend time on training or internal assignments. During a recession, it becomes especially important to ensure that most of the employees’ efforts contribute to client-driven revenue. This metric helps track that balance.
3.2. Overtime Hours
Properly organized labor should allow employees to complete their tasks during regular working hours. Excessive overtime can negatively impact motivation, reduce employee efficiency, and lead to higher turnover. For these reasons, minimizing overtime is essential.
3.3. Labor Cost per Service Delivered
This metric calculates total labor costs divided by the number of service hours. It includes salaries, benefits, and other employee-related expenses. Monitoring this helps in making informed personnel decisions, such as identifying the need for training, motivation, or potential downsizing.
3.4. Turnover Rate
This metric shows the percentage of employees leaving the company over a specific period. A high turnover rate can indicate issues in the work environment or management, while a low rate suggests stability and employee satisfaction.
3.5. Absenteeism Rate
Frequent unexplained absences may indicate low morale within the team. This can have a direct negative impact on overall productivity.
These metrics collectively provide insights into workforce efficiency, enabling businesses to address issues proactively and optimize labor costs during challenging times.
A high absenteeism rate or employee turnover rate indicates the need to determine what is happening within your team. For instance, you could conduct anonymous surveys.
After identifying the problem, it is recommended to take measures to boost employee morale, such as introducing Employee Assistance Programs (EAPs) to address various issues through professional consultations with psychologists, lawyers, or doctors.
Employees may also be interested in a 401(k) retirement plan to build a “financial safety cushion.” If it becomes necessary to reduce some positions, implement layoffs gradually to avoid panic and depressive moods among the remaining staff.
4. Energy Consumption Tracking
Most production operations are associated with high electricity consumption. During a recession, the need to save energy resources becomes more critical. This can be achieved by monitoring important metrics such as:
4.1. Peak vs. Off-Peak Usage
Energy demand is typically higher during peak periods. Producing goods during these times can lead to higher costs. Conversely, shifting production to off-peak hours can lower costs. Tracking this metric allows businesses to adjust production schedules to maximize profitability.
4.2. Energy Consumption per Unit Produced
This metric helps in two ways: calculating the precise cost of production and analyzing the efficiency and sustainability of the manufacturing process. Additionally, a lower energy consumption per unit indicates better environmental performance of the product.
4.3. Equipment Energy Efficiency
This metric evaluates how efficiently equipment uses electricity during operation. Visualizing these indicators allows businesses to rank the most energy-efficient equipment or identify the highest energy consumers. It also highlights the need to transition to more energy-efficient technologies, which not only reduce operating costs but also minimize the environmental footprint.
4.4. Carbon Footprint
This metric measures the environmental impact of a company’s operations, expressed in carbon dioxide equivalent units (CO₂e). It encompasses emissions from fossil fuel combustion, production processes, goods transportation, energy consumption, and other sources. Additionally, it helps identify suppliers with the lowest CO₂e, aiding in more sustainable partnerships. Monitoring the carbon footprint is crucial for minimizing the environmental impact of production.



It’s worth noting that when developing cost-saving measures, it is particularly important for companies to consider their carbon footprint. Many organizations already prioritize suppliers with the most environmentally friendly production practices. By reducing your carbon footprint, you not only contribute to sustainability but also align with the preferences of eco-conscious clients and partners.

5. Operational Efficiency Enhancement
If your company is involved in logistics or delivery in addition to production, it is worth considering opportunities to optimize routes, improve fuel efficiency, account for transportation maintenance costs, and implement cost-saving measures. The following KPIs can assist in analyzing your logistics processes:
5.1. Fuel Efficiency
This metric measures the energy output generated from a specific volume of fuel (e.g., natural gas, coal, petroleum products). In the U.S., it is commonly expressed in gallons per mile. Higher fuel efficiency indicates that vehicles or equipment consume less fuel. Transitioning to high-efficiency technologies naturally results in cost savings and reduces environmental impact.
5.2. Route Optimization Score
This metric evaluates the effectiveness of delivery routes and logistics. Optimizing routes helps reduce travel time, lower fuel consumption, and enhance overall productivity.
5.3. Vehicle Idle Time
This metric tracks the time during which a vehicle is idling, consuming fuel without performing any productive work, such as when the engine is running but the vehicle is stationary. Prolonged idling leads to fuel waste and increased emissions, whereas reducing idle time improves vehicle utilization efficiency.
5.4. Maintenance Costs
This metric reflects expenses related to maintaining equipment or vehicles in working condition, including routine inspections, repairs, replacement of worn parts, and preventative measures. Monitoring this allows businesses to budget for maintenance effectively, prevent equipment breakdowns, and identify the need to replace old equipment with new, more reliable options.
5.5. Delivery Time Accuracy
This metric is essential for courier and delivery companies. Accurate delivery times build customer trust and enhance satisfaction with the company’s service.

By tracking these KPIs, businesses can identify inefficiencies, reduce costs, and improve operational reliability and customer satisfaction.
By monitoring these indicators, businesses can identify ways to calculate and achieve cost reductions. For instance, unscheduled repairs can be avoided by regularly maintaining vehicles and equipment. Additionally, analyzing ways to reduce idle time—such as optimizing logistics or streamlining loading and unloading processes—can improve efficiency. In some cases, it may be more practical to dispose of equipment that is rarely used and frequently breaks down, replacing it with more reliable alternatives.

6. Customer Segmentation and Targeting
Almost every online business invests in marketing strategies to attract customers. Whether you outsource tasks or maintain an in-house team, measuring marketing efficiency is essential, as it directly impacts company revenue. The following metrics can assist in evaluating and optimizing marketing efforts:
6.1. Customer Lifetime Value (CLV)
This metric reflects the total profit a company can earn from a single customer over the course of their relationship. It also helps determine the cost of acquiring and retaining a customer and assesses their long-term value to the business. Increasing CLV can be achieved by improving service quality, offering tailored proposals, and developing loyalty programs.
6.2. Acquisition Cost per Customer
This metric calculates the cost of acquiring a new customer, including all marketing and advertising expenses. If customer acquisition proves too expensive, it’s crucial to analyze cost-reduction opportunities. This metric allows businesses to evaluate the effectiveness of various strategies and identify the channels that generate more traffic at a lower cost.
6.3. Repeat Purchase Rate
This metric shows the percentage of customers who make repeat purchases within a specified time frame. It helps assess customer loyalty and the effectiveness of marketing strategies. A higher repeat purchase rate indicates satisfied customers who appreciate the product and service. A lower rate signals the need for improvements in quality, loyalty programs, and promotional campaigns.
6.4. Churn Rate
This metric represents the percentage of customers who stop using a company’s products or services over a specific period. A high churn rate may indicate issues in meeting customer needs or dissatisfaction with the product. It may also highlight ineffective advertising that attracted unqualified leads.


Tracking these metrics allows businesses to refine their customer acquisition and retention strategies, ensuring better returns on marketing investments and fostering long-term customer relationships.
Of course, no marketing strategy works instantly. Therefore, it is recommended to analyze data and adjust the strategy quarterly. This time frame allows you to identify which promotions and offers resonate better with customers. When response rates are similar, you can calculate which strategies are more cost-effective. For example, if customers respond equally well to discounts and additional gifts, the company should determine which option is more advantageous to offer.

7. Accurate Sales Forecasting
When seeking solutions to navigate a financial crisis, understanding potential revenue is critical. This knowledge allows businesses to secure payment deferrals from partners if necessary and attract investments. Companies must evaluate their expected sales to determine budgets for advertising or the feasibility of expanding their product range. The following metrics are essential for effective forecasting:
7.1. Forecast Accuracy
This metric measures how effectively a company can plan its actions. For instance, if previous forecasts were 70–95% accurate, it indicates competent sales forecasting. However, if accuracy falls below 50%, the situation is critical, and seeking assistance from external experts may be necessary.
7.2. Sales Trend Analysis
This metric helps identify how sales change over time, uncover long-term trends, and recognize seasonal demand fluctuations for specific products. With this analytical data, companies can make better-informed decisions regarding bulk purchases and production strategies. Forecasting is thus a vital tool for successful business management.
7.3. Demand Variability
This metric assesses changes in demand for products. Unlike sales trend analysis, which shows the overall revenue, demand variability includes the number of units sold. For example, inflation may force you to increase prices, leaving total revenue unchanged but reducing the number of units sold. Understanding these shifts helps in planning inventory, production, and marketing strategies more effectively.
7.4. Stock Availability Impac
This metric quantifies revenue losses due to stockouts. When items are in stock, customers are satisfied, and the likelihood of lost sales decreases. Conversely, when stock runs out, customers may turn to competitors.


As you can see, accurate forecasting influences critical decisions about product assortment, inventory levels, and marketing investments. These actions help maintain customer loyalty, even during periods of rising prices.

8. Vendor Performance and Compliance
Preparing a business for a recession will be more effective for companies that carefully select their suppliers. Confidence in receiving quality products on time reduces the need for large inventory reserves, lowers storage costs, enhances flexibility in resource management, and improves overall operational efficiency. These factors are crucial, as recessions often stress supply chains. The following metrics can help identify the best suppliers:
8.1. Compliance Rate
This metric evaluates how well a supplier adheres to your predefined criteria, such as defect rates, product shelf life, standard compliance, and adherence to agreements. Expressed as a percentage, it shows how effectively the supplier meets your business’s specific requirements.
8.2. Fill Rate
This measures the percentage of orders completed on time and in full. Typically expressed as a percentage, it indicates how well a supplier fulfills customer requests. A high fill rate signifies reliability, whereas a low rate might suggest supply chain or inventory issues.
8.3. Invoice Accuracy
This metric assesses the accuracy of invoices issued by the supplier. Accurate invoicing minimizes financial losses and helps maintain client trust. Fewer errors mean a reduced likelihood of disputes or missed payments.
8.4. Cost per Vendor Error
This metric calculates the expenses incurred due to supplier mistakes, such as incorrect shipments, defective products, or invoicing errors. It highlights the financial impact of errors and motivates suppliers to enhance quality control processes.


Ensuring vendor compliance is essential for maintaining high product and service quality standards. It also fosters trust and strengthens business relationships, promoting long-term collaboration and sustainable growth. This is especially critical for companies that rely heavily on supply chain operations.

9. Expense Management and Reduction
Effective budget planning begins with a thorough analysis of company expenses, followed by specific cost-saving measures. This can involve negotiating with suppliers, reducing excessive inventory, optimizing logistics routes, or lowering administrative expenses. Each step must be carefully planned to avoid compromising product or service quality. Since expense structures vary across companies, it’s crucial to monitor key KPIs to identify areas for improvement. We recommend integrating Power BI analytics to track the following operational metrics:
9.1. Spend Analysis by Category
Software can classify various expense categories, such as marketing, procurement, production costs, banking services, rent, and more. The collected data helps identify high-cost areas, enabling targeted budget optimization in the most expensive categories.
9.2. Budget Adherence
This metric measures how closely actual expenses align with the planned budget. Ideally, revenue and expenses should be balanced. However, having a 50% budget surplus doesn’t always indicate success—it may signify underinvestment in marketing or development, potentially leading to a competitive disadvantage in the long run.
9.3. Cost Reduction Opportunities Identified
This metric highlights areas where costs can potentially be reduced without compromising quality or efficiency. Examples include better inventory management, renegotiating supplier contracts, or optimizing operations. For instance, a medical center with multiple branches may find one location paying higher rent due to a prestigious area. This could prompt renegotiation or relocation. Other cost-saving strategies might include avoiding purchases of slow-moving inventory, reducing energy consumption by operating during off-peak hours, or automating repetitive tasks to reduce labor costs
9.4. Expense Trend Over Time
Visualizing a graph of expenses over weeks or months can reveal spending patterns and seasonal cost drivers. For instance, certain periods may require higher procurement volumes or increased reliance on contractors.
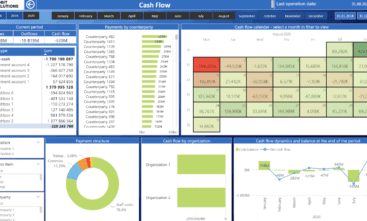

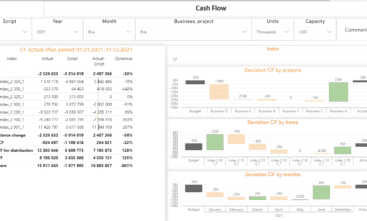

Every company must track where funds are primarily spent, whether those expenses are justified, and whether investments yield profits. Understanding this allows businesses to calculate potential cost savings effectively. As a result, companies can renegotiate supplier contracts, seek more favorable deals, or cut unnecessary expenditures.

10. Product Profitability Analysis
For companies involved in manufacturing or retail, tracking product profitability is essential for accurate purchasing forecasts and precise cost-saving calculations. The goal of this analysis is to identify the most profitable products and optimize the product range to maximize overall company profitability.
Key KPIs for this analysis include:
10.1. Gross Margin per Product
This metric reflects the profit generated by each sold item after deducting its cost of production. It can also highlight which products drive the highest sales. For example, a door-selling company might find that the majority of its profit comes from hardware accessories such as locks and handles, rather than the doors themselves.
10.2. Sales Volume
This metric tracks the number of units sold over a specific period. It’s critical because some products may have high margins, while others with lower margins might drive the bulk of sales due to their affordability. This balance should be considered when planning procurement.
10.3. Cost of Goods Sold (COGS)
This metric calculates the total expenses associated with producing goods or services. COGS may include raw materials, labor, energy costs, fuel, and other inputs. Knowing the COGS is crucial for determining gross profit and evaluating overall product profitability.
10.4. Return Rates
This metric shows the percentage of products returned by customers. It is important for assessing product quality, customer satisfaction, and sales effectiveness. High return rates may indicate issues such as product defects, inaccurate descriptions, or mismatched customer expectations.


Every product involves direct and indirect costs such as manufacturing, marketing, and distribution. Therefore, businesses need to understand how much revenue remains after covering these costs and how profitable each product is. By analyzing these metrics, companies can make informed decisions about which products to expand and promote, and which to phase out.

11. Marketing ROI Optimization
During a recession, many companies cut back on marketing expenses, which can be a significant mistake since driving sales becomes more critical than ever. Instead, it’s advisable to thoroughly analyze the effectiveness of individual marketing strategies and allocate more resources to the most cost-effective channels for customer acquisition. How can this analysis be conducted? It’s relatively simple, as the success of promotions, loyalty programs, and other marketing activities can be evaluated using the following metrics:
11.1. Return on Marketing Investment (ROMI)
ROMI is calculated as the ratio of profit to the expenses incurred on marketing activities. This metric helps businesses determine whether marketing investments are paying off and identify which channels or campaigns warrant increased funding.
11.2. Conversion Rates
This metric shows the percentage of users who performed a target action out of the total number of visitors. Target actions could include purchases, subscriptions, registrations, downloads, or any other key activity for the business. It’s calculated by dividing the number of conversions by the number of visitors, expressed as a percentage.
11.3. Cost per Acquisition (CPA)
CPA measures how much it costs the company to acquire a single customer. It’s calculated as the total amount spent on a marketing campaign divided by the number of customers acquired or conversions achieved. This metric is critical for analyzing the profitability of marketing strategies and improving their efficiency.
11.4. Channel Performance
This metric evaluates which channels bring in the most customers, such as social media, email campaigns, paid advertisements, or SEO-optimized blogs. It allows businesses to analyze cost-saving opportunities by understanding which channels deliver the best results.


Why track multiple metrics?
Different channels have varying strengths. One channel may generate a higher volume of leads, while another attracts more qualified prospects. For instance, social media, often used for entertainment, may bring in many customers for promotional products. Meanwhile, email campaigns can segment the audience and send exclusive offers to highly interested buyers. However, it’s essential to analyze whether one high-value purchase is worth more than a dozen smaller ones. These insights allow for smarter allocation of marketing budgets and optimization of strategies.

12. Revenue Leakage Detection
Operational inefficiencies, accounting errors, incorrect billing, or undervaluing products and services often lead to lost profits. These issues may initially go unnoticed but can accumulate over time, significantly impacting overall revenue. Using metrics and analytical tools like Power BI, businesses can identify potential sources of revenue leakage. Key areas to analyze include:
12.1. Billing Accuracy Rate
This metric reflects the percentage of correctly issued invoices relative to all invoices during a specific period. Maintaining high billing accuracy reduces errors that could lead to lost revenue and customer dissatisfaction.
12.2. Unbilled Revenue
This metric highlights income the company has earned but not yet received because invoices have not been issued. It’s crucial for tracking financial flows accurately. Unbilled revenue often occurs in long-cycle projects where services or goods are delivered, but invoicing happens later—or in cases where invoices are simply forgotten. Monitoring all projects ensures no revenue slips through the cracks.
12.3. Dispute Resolution Time
This metric measures the time taken to resolve client complaints or disputes. It’s critical for assessing the efficiency of customer support teams and the overall quality of customer service. Faster dispute resolution correlates with higher customer satisfaction and loyalty.
12.4. Lost Revenue Recovery
This metric tracks how much money the company has managed to recover due to resolving disputes, correcting errors from missed invoices, or obtaining refunds for defective goods from suppliers over a given period.


Why is this monitoring important?
Continuous tracking of key indicators and regular reporting on revenue leakage helps businesses identify progress and respond quickly to emerging problems. For instance, if dispute resolution takes too long, businesses should investigate potential causes such as:
- Product Quality: High defect rates leading to returns or complaints.
- Service Quality: Inefficiencies in employee performance or customer support.
- Marketing Practices: Misaligned promises in promotions or advertisements.
By addressing these issues, companies can reduce revenue leakage and improve overall profitability.

13. Project Management Efficiency
For product companies offering marketing and other digital services, it is crucial to understand how successfully and efficiently they achieve their goals. Are deadlines met, budgets adhered to, and quality standards achieved? It is vital to track the following metrics:
13.1. Budget Utilization
This metric assesses how rationally financial resources are allocated and spent. Effective budget utilization reflects sound financial planning and management.
13.2. Schedule Adherence
This metric shows how well tasks and projects align with planned deadlines. Measured as a percentage, it indicates the proportion of tasks completed on schedule. It is useful for identifying and addressing causes of delays.
13.3. Resource Allocation Efficiency
This metric evaluates how effectively resources are used and whether tasks are appropriately distributed among project participants.
13.4. Project Overhead Costs
This metric reflects expenses not directly tied to production or specific task execution but necessary for project maintenance and management.


Achieving project goals within the established timelines and budget while maximizing available resources is an essential objective for any IT company. This can be realized with unique talent—specialists who excel at teamwork, adapting to current conditions, solving issues quickly, or justifying the need for additional time or technologies.
For projects prioritizing a fast launch, temporary use of ready-made solutions (e.g., website builders) can be effective. However, if a company seeks uniqueness and recognizability, it must invest time in market and competitor research, testing, audience surveys, and platform development to create a truly exclusive product.

14. Predictive Maintenance
All manufacturing equipment wears out or becomes obsolete over time. However, if the equipment is properly maintained and scheduled repairs are performed, it will help avoid premature wear and tear. As a result, the company will not have to incur unnecessary expenses for costly unplanned repairs or look for funds to purchase new equipment. Let’s see how to calculate the cost avoidance of premature equipment replacement using these metrics:
14.1. Mean Time Between Failures (MTBF)
This is a measure of equipment reliability that calculates the average operational time of a system or device before the next failure occurs. MTBF is calculated by dividing the total operating time of the equipment by the number of failures over a specific period. This metric helps assess the durability and reliability of the equipment, thereby enabling the planning of maintenance and improving production efficiency.
14.2. Maintenance Costs
This metric shows all expenses related to keeping equipment or systems operational. The analysis includes regular maintenance, repairs, spare parts, and labor. By tracking these indicators, companies can determine whether it is more cost-effective to buy new equipment or continue using the existing one until it is fully worn out.
14.3. Equipment Health Indicators
These are a set of parameters and data used to assess the current condition and performance of equipment. These indicators may include temperature, vibration, pressure, wear levels, and other factors. Monitoring this data helps identify potential problems before they occur and conduct timely maintenance, extending the equipment’s lifespan.
14.4. Scheduled vs. Unscheduled Maintenance Ratio
This metric compares the number of planned preventive maintenance tasks with unplanned repairs. A high ratio in favor of scheduled maintenance indicates effective equipment management. If a business overuses equipment to the point of failure, it can lead to additional downtime.


Analyzing data on equipment conditions helps both calculate cost savings and improve overall production efficiency. This is facilitated by early detection of failures and their prevention through timely repairs.

15. Production Line Efficiency
The question of how to prepare your business for a recession may take a back seat if you focus on production line efficiency metrics. These can include an overall assessment of equipment performance, production line throughput, and product yield rates. Let’s examine how to calculate cost savings in production using the following KPIs:
15.1. Overall Equipment Effectiveness (OEE)
This is a comprehensive performance metric that measures the efficiency of equipment utilization. OEE considers three key aspects:
- Availability: The percentage of time the equipment is operational.
- Performance: The degree to which the equipment operates at maximum efficiency.
- Quality: The percentage of products that meet quality standards.
OEE allows businesses to identify and address losses in the production process in a timely manner.
15.2. Units Produced per Hour
This productivity metric reflects the number of products produced in one hour of work. It helps assess the efficiency of the production line and identify opportunities for optimizing the production process.
15.3. Cycle Time
This is the time required to complete the production process from start to finish. It is a key metric for identifying optimization opportunities. Cycle time includes all stages, starting from the preparation of raw materials for processing to the inspection of finished products.
15.4. Yield Rates
This metric determines the volume of goods produced over a specific period. It also reflects the percentage of products meeting quality standards out of the total production volume. Yield rates can be compared across different workshops or sections to understand which department operates more efficiently. This helps identify and address bottlenecks in the production process in a timely manner.
15.5. Setup and Changeover Time
This metric measures the time spent preparing equipment for a new production task. This may include tool installation, equipment adjustments, testing, and other preparatory work. Reducing setup and changeover time helps increase production flexibility and productivity.
15.6. Capacity Utilization
This metric measures the percentage of total production capacity that is actually used for producing goods. It helps assess the efficiency of resource utilization and identify opportunities for increasing productivity.


Quality control and timely detection of defects help reduce the number of defective products, evaluate employee performance, and promptly identify equipment deficiencies. When each link in the chain operates correctly, overall productivity improves, and the number of client disputes—which negatively affect the company’s rating and revenue—decreases. As a result, both the company and its clients benefit from optimized production.
47 SUCCESSFUL COMPANY DASHBOARD
PROJECTS IN 22 INDUSTRIES
We create customized BI solutions. We love difficult tasks, but we can help you with simple ones too.
Industry-focused case studies designed for your needs


Advantages of Data Analytics for Business

Above, we reviewed several dozen KPIs that provide an accurate picture for analyzing business expenses. Of course, these are not all the metrics but only the main ones. In the process of working with a specific company, we select those KPIs that allow for more informed decision-making and strategy building based on real data rather than intuition. This helps businesses better understand their audience, optimize processes, improve competitiveness, and identify which factors can be used to evaluate cost-saving plans.
Among the key advantages of data analytics:
Trend Forecasting
Allows businesses to predict market changes, adapt to them, and remain competitive.
Cost Savings for the Company
Analysis helps identify the most expensive areas and find ways to optimize them
Improved Customer Satisfaction
Analyzing customer behavior data allows for personalized services and offers, increasing loyalty.
Improved Operational Efficiency
Process and resource optimization through data analysis helps increase productivity and reduce costs.
Support in Strategic Decision-Making
Data helps create more accurate strategies and determine priority directions for company development.
Data analytics is the foundation of successful business management, enabling a company to be flexible, rational, prepared for market changes, and capable of developing optimal strategies for navigating a business recession.
Tools and Software for Data Analytics

To perform effective data analysis, companies choose various tools or software, such as:
- Power BI – a powerful platform for data visualization and creating interactive reports. It supports integration with various data sources and allows users to quickly gain analytical insights, make forecasts, and share reports in real time.
- Google Analytics – a tool for analyzing user behavior on websites. Useful for marketing teams and online business owners, it enables tracking of traffic, visit sources, and conversions.
- Microsoft Excel – a classic tool for working with data, including functions for analysis and visualization. Excel remains one of the most popular tools for analytics due to its flexibility and functionality.
- Tableau – a business analytics platform that supports extensive visualization capabilities and allows analysis of large data volumes from various sources.
- SQL and Databases – tools for working with databases (such as MySQL, PostgreSQL, Oracle) help collect and structure data, making it available for in-depth analysis.
- Python and R – programming languages often used for more complex and customized analytical tasks. They enable analysis of large data sets, development of predictive models, and automation of processes.
These tools provide robust support for analytics, but Power BI stands out for its integration capabilities and ease of use, making analytics accessible to users of all skill levels. It enables a clear view of how to prepare for a company’s economic crisis and continue operating successfully under new conditions.
Why Do We Recommend Power BI?
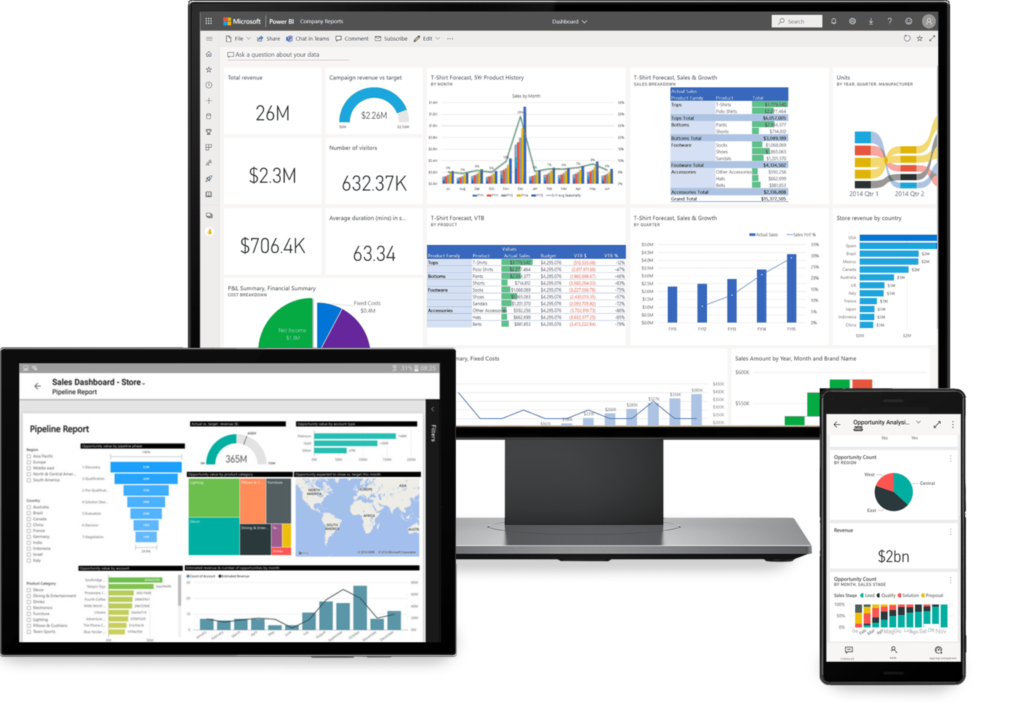
Power BI supports integration with a wide variety of data sources, ranging from Excel and databases to cloud services. This makes it easy to collect and consolidate data. The system offers powerful tools for visualization and interactive report creation, simplifying data analysis for users without technical expertise.
Power BI also includes built-in features for data cleaning and quality assurance, helping to eliminate errors and inaccuracies. Additionally, the tool provides high security standards and access management, enabling secure data handling and ensuring compliance with privacy requirements.
Conclusion
Let’s summarize. By analyzing data on expenses, company profitability, identifying potential problems in time, and seeing the real-time picture, you will be much better equipped to address the question of how to survive a business recession compared to companies that do not use modern software and management approaches. We remind you that this helps to:
- Analyze sales trends and identify the most profitable products or services.
- Monitor inventory levels and forecast demand, avoiding surpluses or shortages.
- Visualize financial indicators such as profit, expenses, and profitability to make informed decisions.
- Track employee productivity through performance metrics.
- Evaluate the results of marketing campaigns and their impact on the business.
- Study customer behavior and provide personalized offers.
- Identify potential risks and minimize their impact on the business.
- Analyze operational process efficiency and find opportunities for optimization.
And this is far from a complete list of the capabilities provided by Power BI. You can access virtually any data you need in real time, in a convenient and readable format, and respond quickly to changes. If you are interested in integrating the system, request a consultation with a Cobit Solution specialist. We handle projects of any complexity, developing custom solutions for both small and large businesses.
Take advantage of modern digital data interpretation to instantly eliminate errors and maximize the potential of your business during a recession!
Frequently Asked Questions

A recession is a period of economic decline, characterized by consecutive months of decreasing gross domestic product (GDP) in a country. It is usually triggered by external or internal factors such as financial market crises, high inflation, sharp changes in energy prices, or global economic shocks. During this time, business activity contracts, unemployment rises, household incomes fall, and consumption levels decrease. All these factors further slow the economy, creating a domino effect.
Protecting your company from a recession means preparing it to operate in conditions of economic decline by minimizing financial risks and ensuring stability. This involves several key steps, such as:
- Optimizing Expenses – reduce non-essential costs, review budgets, and focus resources on critical areas.
- Diversifying Revenue – seek new income sources or expand your range of services to reduce dependence on a single direction.
- Strengthening Inventory Management – avoid overproduction and unnecessary storage expenses.
- Building Reserves – create a financial cushion to ensure the company’s liquidity during challenging times.
- Working with the Customer Base – focus on building relationships with new clients and enhancing the loyalty of existing customers.
It’s essential to analyze key performance indicators before taking any steps. This ensures that preparations for a crisis are more effective.
Diversity and inclusion play a critical role in stabilizing a company during a recession. When an organization strives to create equal opportunities for all employees, regardless of gender, age, ethnicity, physical ability, religious beliefs, or other characteristics, the team becomes stronger and more cohesive. Companies with such teams are generally more flexible, better prepared to respond to changes, and thus more competitive during challenging times.
It is essential for all employees to feel accepted and respected and to have the opportunity to fully realize their potential. Moreover, an inclusive culture creates a comfortable environment for talented employees, enhancing their satisfaction and loyalty to the company. This reduces employee turnover and hiring costs.
A recession can present opportunities for those ready to adapt and leverage changes in the market. Strategies to succeed during a downturn include:
- Investments – during a crisis, prices for stocks, real estate, and other assets often drop. The key is to consistently monitor opportunities for profitable investments.
- Market Expansion – changes in consumer behavior can reveal niches for new products or services that meet current customer needs.
- Process Optimization – a recession prompts companies to reevaluate internal processes, reduce expenses, and improve efficiency. This helps maintain competitiveness over the long term.
- Attracting Unique Talent – with widespread layoffs in the job market, companies can hire specialists who might otherwise have been unavailable.
- Implementing Innovations – unique talent can bring fresh ideas for new product or service developments. This opens up incredible opportunities for business growth during a crisis.
A recession is not just a challenge but also an opportunity for those ready to act strategically. To prepare a company effectively for a recession, it is essential to focus on optimizing processes and reducing costs without affecting core operational functions.
During a recession, businesses offering essential goods and services that remain in demand regardless of economic conditions tend to thrive. These include grocery stores, pharmacies, healthcare providers, and companies offering repair and maintenance services.
Businesses focused on cost-saving solutions, such as discount retailers and rental services, also typically experience high demand. Additionally, educational platforms and online courses become increasingly popular during economic downturns, as people seek to improve their skills and enhance their career prospects.


