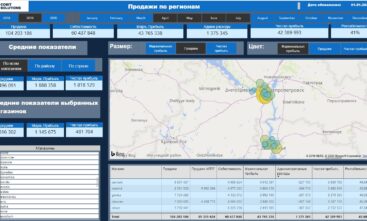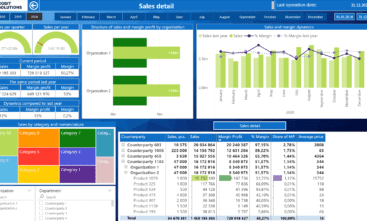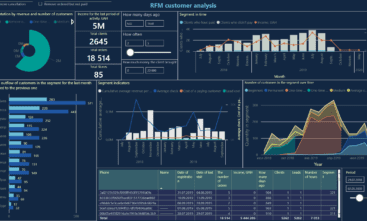
Salesforce dashboard is based on the company’s sales and marketing. Results can significantly affect the current state of the business, so sales teams’ heads should track the team’s metrics to correct them for progress and success.
This process was too hard and time-consuming with old static, overwhelmingly detailed, and incompatible handwritten reports.
Nowadays the decision makers can provide data-oriented decision-making using customer relationship management (CRM) dashboards, example of it is the Salesforce dashboard.
Power BI analytical dashboards differ by contents, precision, and possibility to handle the most important KPIs and metrics.
Salesforce Dashboard
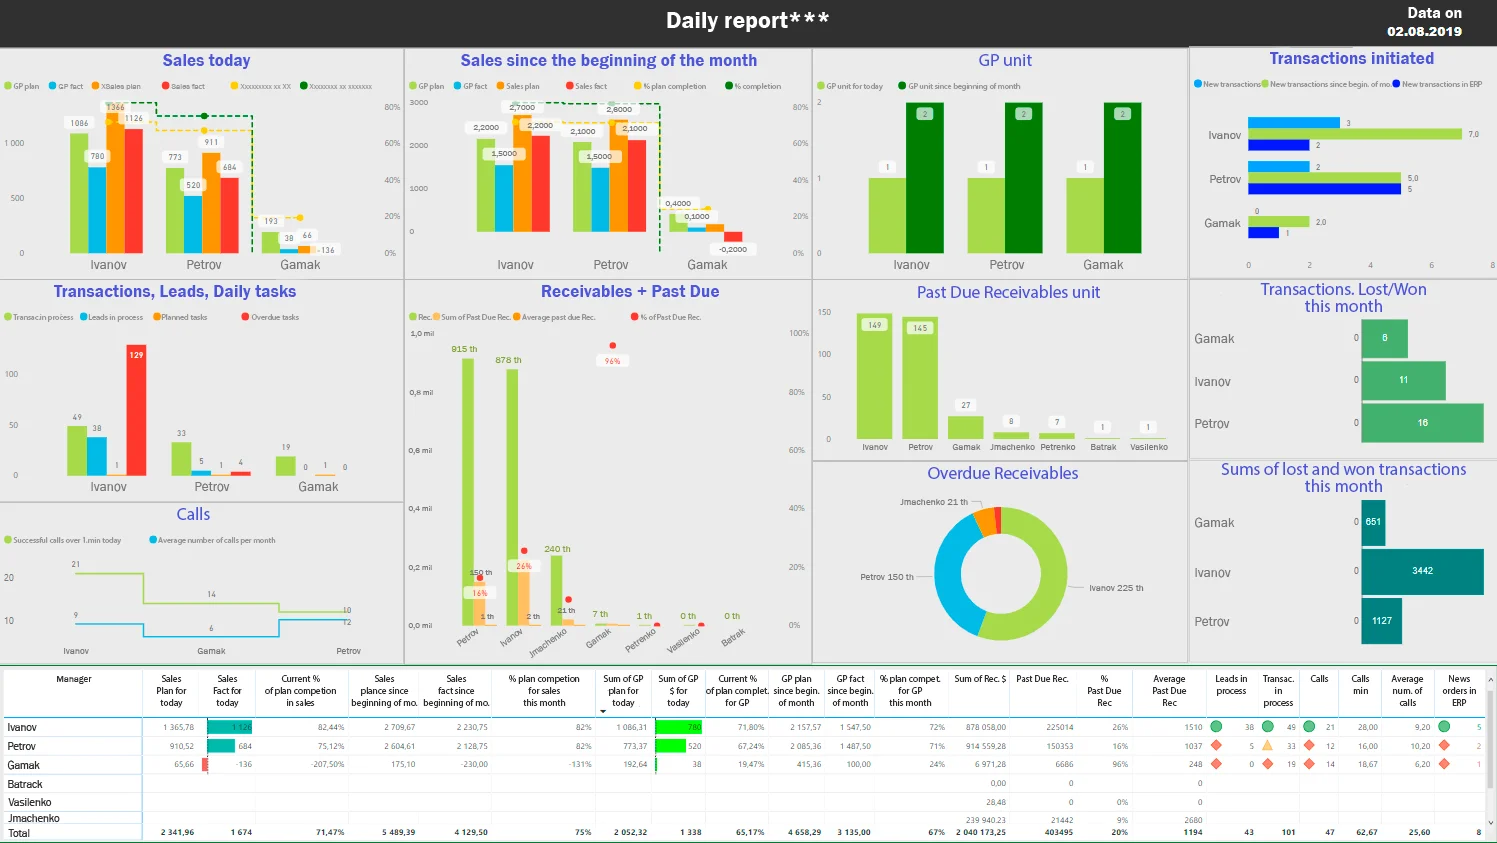
What is a Salesforce Dashboard?
The interactive analytics tool shows the most meaningful data as a company’s sales, activity of each member and results of services provided. It helps process the current state of business, forecast the situation, provide better customer service and avoid the pitfalls before they become a problem.
CRM dashboards provide detailed information about clients, team performance for better motivation and rewarding plus detailed pass of the sales cycle stages.
To summarize the advantages of the dashboard effectiveness they offer excellent ROI (return on investment): after one month of their implementation companies show significant conversion rates increase, revenue by 29% and sales team productivity by 34%.
The metrics in the Salesforce dashboards may include:
- Number of successful deals,
- Gross profit by managers,
- Gross cash flow - shows the gross margin for each manager
- The amount of discounts provided by managers in money - Shows the amount of the discount granted for each manager,
- Gross profit = sales profit – cost of goods sold (works, services),
- Marginal profit = revenue - variable costs,
- Accounts receivable by managers - client debts assigned to managers,
- Net profit = revenue - cost of goods - management and selling expenses - other expenses - taxes,
- Operating Cash Flow = net income - non-cash expenses (Amortization, Impairment) - interest (paid) on loans - income tax,
- % execution of the call plan by managers - ratio of real calls to plan.
- % sales plan performing - a ratio of sales fact to plan.
What does the Salesforce dashboard show and what is it for?
As the name hints, the Salesforce customer dashboard is the tool to monitor and analyze business and sales processes, and team performance.
This way interactive Power BI dashboards serve the company’s employees the most valuable tracking data updated on a daily basis. Salesforce custom dashboard aggregates on one screen the key performance indicators (KPIs). The system collects all the vital metrics from multiple sources across the organization to visualize it in clear graphs and charts easy for understanding.
Read about the Marketing dashboard to bost your sales.
What are the target roles and dashboard users?
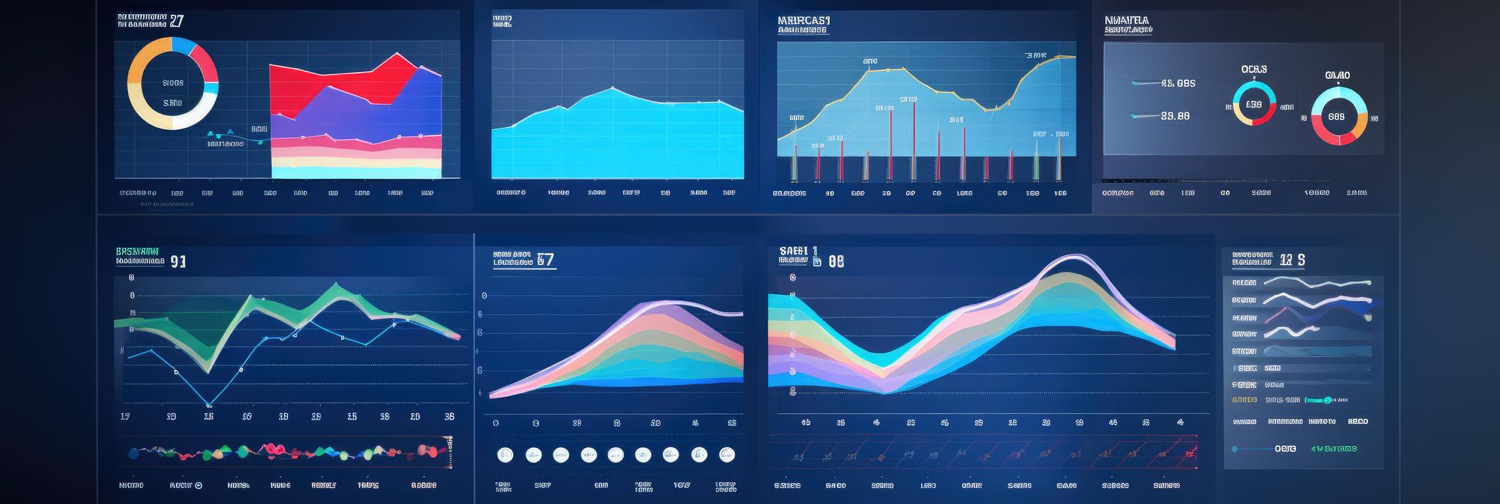
Generally all the key persons of the company need to track and provide financial control of business workflow. Dashboard salesforce target roles and users positions in the organization are:
- CEO
- COO
- sales persons
- head of sales
Other types of Salesforce dashboard:
![other-types [:en]other-types[:]](https://cobit-solutions.com/en/wp-content/uploads/sites/2/elementor/thumbs/other-types-qgnue2pgswv9mricvzazq6ibxfusomn01y8n3454sm.gif)
The dashboard deconstructs the sales process into atoms and finds the inefficiencies. It helps clients increase their income and net margin via IT Business Intelligence. Handy provisions for 24/7 access to the data from any device, better data-informed decisions in the moment, ability to follow the strategic goals make them a top wanted tool for the market.
- You might also be interested how to improve overall performance in manufacturing industry
- Read more about BI consulting and advisory

“Power BI dashboard forms the newly tailored and updated data panel, each time you look into the browser from your personal computer or phone. You don’t need to ask somebody to prepare it for you or recalculate it” – says Dmytro Chashnyk, CEO of Cobit Solutions, Expert in IT with 19 years of experience, 10 years on CIO/CTO positions.

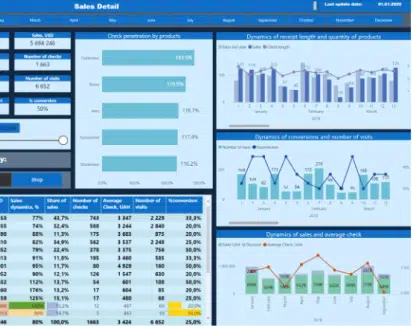
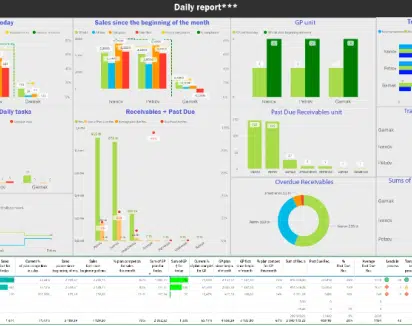
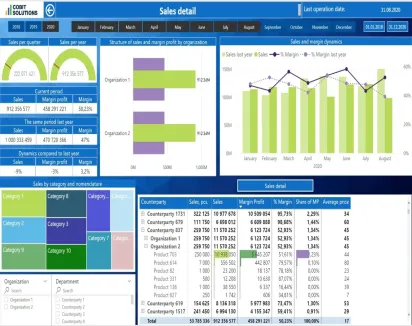
SALESFORCE DASHBOARD VARIATIONS
Our Power BI consultants will develop tailor made dashboards that will help effectively control sales
OUR Power BI consultancy benefits
- Leveraging best practices:
- Saving your time and money
- Power BI and data technology experts implementing turn-key data solutions
- Delivering customized dashboards crafted for your organization's needs
- 20-30% less expensive than hiring a local FTE.

Power BI, ETL, DWH Development:
![stars [:en]stars[:]](https://cobit-solutions.com/en/wp-content/uploads/sites/2/elementor/thumbs/stars-qgeqdxws1hhfn9upqdtmmw31jxbq3judwkbn7z9ec0.gif)
Turn-key BI implementation services:
ETL Data
Integration
Get the turnkey ETL data integration services for ERP, API, CRM, DB, Excel and any other IPs
BI Dashboard
Development
Build custom dashboards tailored to business needs, including front-end interfaces and core back-end technologies
Platform and
Infrastructure
Transforming your data silos into high-end decision-making tools on the Power BI platform for daily updated reports.
AI/ML and
Data Science
Implementing AI/ML and data science options into interactive analytics solutions that help organizations increase revenue and margins
What's Your Stack?
