The Role of Data Analytics in Modern Healthcare
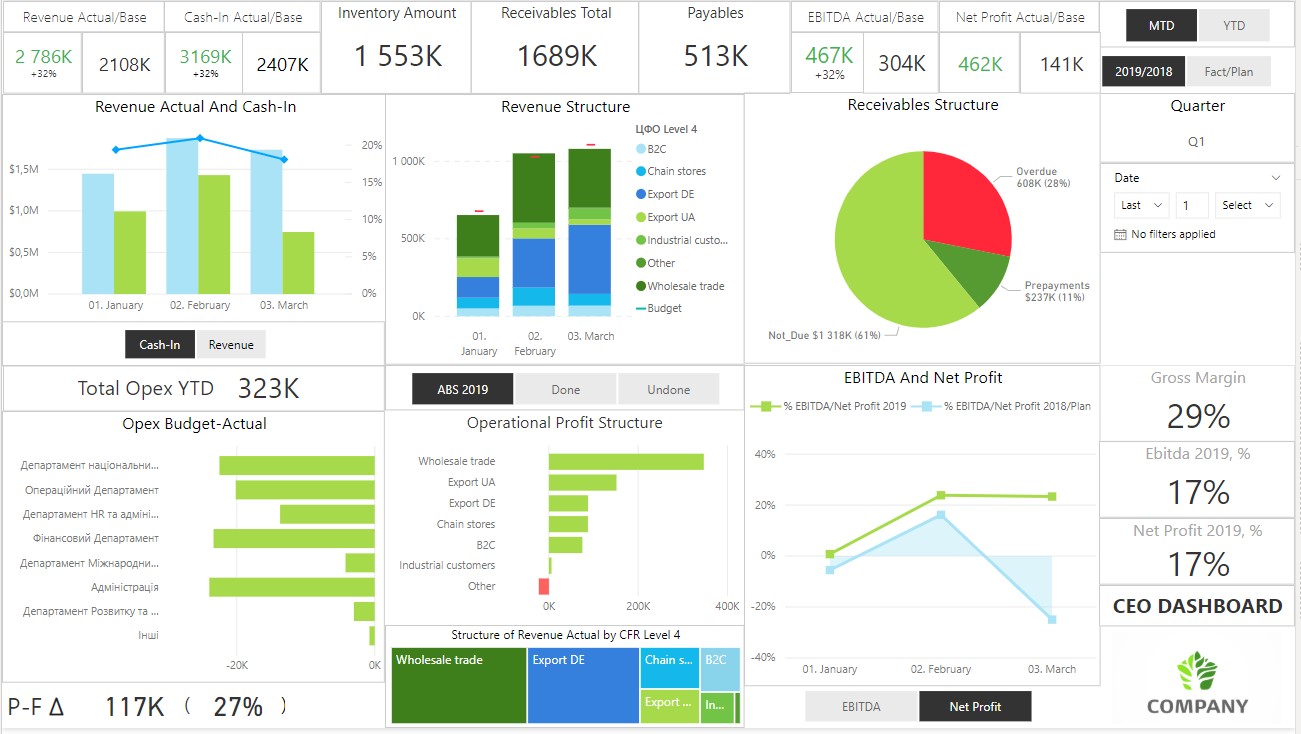
Dobrobut, the largest private clinic network in Kyiv and its surrounding region, including their own emergency services, has seen significant growth. Initially, they sought simple Power BI dashboards for BSC (Balanced Score Cards) to monitor visits, main clients, and services. However, the project evolved into a comprehensive business intelligence in healthcare solution, featuring interactive dashboards for financial reporting (PNL), revenue tracking, and forecasting tailored to their methodology. These Power BI dashboards have become essential tools for operational directors, driving efficiency and improving business processes during weekly meetings.
A Leading Healthcare Network Driving Innovation
The Dobrobut Medical Network is the first network of private medical facilities in Ukraine, established to operate on modern standards of excellence in grant medicare, leveraging healthcare business intelligence to enhance operations and patient care.
Challenges in Healthcare Analytics: How Medical Chain Found Solutions with Power BI
As a result of Dobrobut’s rapid expansion, the company needed to make the shift from primary analytics to more sophisticated, interactive financial reporting and operational dashboards that were created with Power BI.
The initial challenge was creating fundamental dashboards to monitor key performance indicators. During the project, it became clear that more comprehensive and interactive analytics were required. These included dashboards for tracking utility expenses, capital investments, balance sheets, emergency services, and customer feedback.
We started with basic Power BI analytics, which quickly became a vital part of Dobrobut’s weekly planning sessions. As their needs grew, we developed specialised business intelligence software in healthcare, including:
- Utility Expenses: Detailed tracking of departmental utility costs.
- Capital Investments: Dashboards for monitoring major assets and equipment.
- Balance Sheets: Comprehensive views of the clinic’s financial health.
- Emergency Services: Analysis of emergency calls by frequency and time-of-day patterns.
- Customer Feedback: Eight dashboards showcasing client feedback on specific services for a clear overall picture.
By collaborating closely with Dobrobut, our team of business analysts proposed and implemented additional data types and directories, ensuring the healthcare business intelligence solutions provided were both technically robust and tailored to Dobrobut’s needs. These solutions, powered by healthcare BI software, transformed their operations with actionable insights and efficient decision-making tools.

Thanks to dashboards, we can also make a forecast of our financial indicators for a month, quarter or half a year and have the opportunity to compare the actual financial result with our predicted one – to understand the completeness of the reflection of expenses and income

Clinic Success with Power BI Analytics

The implementation of interactive analytics with Power BI transformed Dobrobut’s business processes, enabling specialists to focus on monitoring and control functions, reducing manual work, and enhancing daily oversight. Key outcomes included:
- Operational Efficiency: Significant improvements in business processes, allowing specialists to shift from manual tasks to control functions, supported by healthcare BI solutions.
- Financial Control: Detailed Power BI dashboards for financial reporting and forecasting, now indispensable for operational directors, showcasing the impact of business intelligence software for healthcare.
- Customer Insights: Comprehensive feedback dashboards provided actionable insights for service improvement and client satisfaction, demonstrating the power of business intelligence healthcare tools.
- Scalability: As the number of clinics expanded, the financial department focused on control functions, eliminating the need for additional staff, a testament to the efficiency of tailored BI solutions.
These healthcare BI solutions have enabled Dobrobut to streamline operations, enhance decision-making, and scale seamlessly with data-driven insights.
Get in Touch with Us
Interested in transforming your business with Power BI and interactive analytics? At Cobit Solutions, we specialize in delivering cutting-edge business intelligence for healthcare, enabling organizations to achieve real-time insights, operational efficiency, and data-driven decision-making. Our tailored solutions include hospital business intelligence software, designed to meet the unique needs of healthcare providers, from clinics to large hospital networks.
With expertise in healthcare BI, we help you harness the power of interactive dashboards and advanced analytics, providing comprehensive visibility into critical areas such as financial reporting, operational performance, patient feedback, and resource utilization. Whether you’re looking to optimize processes, improve patient outcomes, or scale your operations efficiently, our solutions ensure you remain at the forefront of the business intelligence in the healthcare industry.
Contact Cobit Solutions today to learn how we can help you transform your organization with advanced analytics and innovative BI tools. Let’s schedule a call to discuss your needs and explore how our business intelligence for healthcare solutions can drive your success.
Developing the business becomes more comfortable when you regulate the workflows according to the fast reports with interactive analytics.


