

DOWNLOAD FREE CHECKLIST
of 25 recommendations for successful BI implementation


We implemented Power BI for an energy company, delivering custom dashboards for real-time energy metrics, fuel management, and financial reporting. These business intelligence solutions streamlined operations, improved data accuracy, and enhanced decision-making.
of 25 recommendations for successful BI implementation
Cobit Solutions commits to delivering a comprehensive, turnkey solution within four months


23 Dec 2023
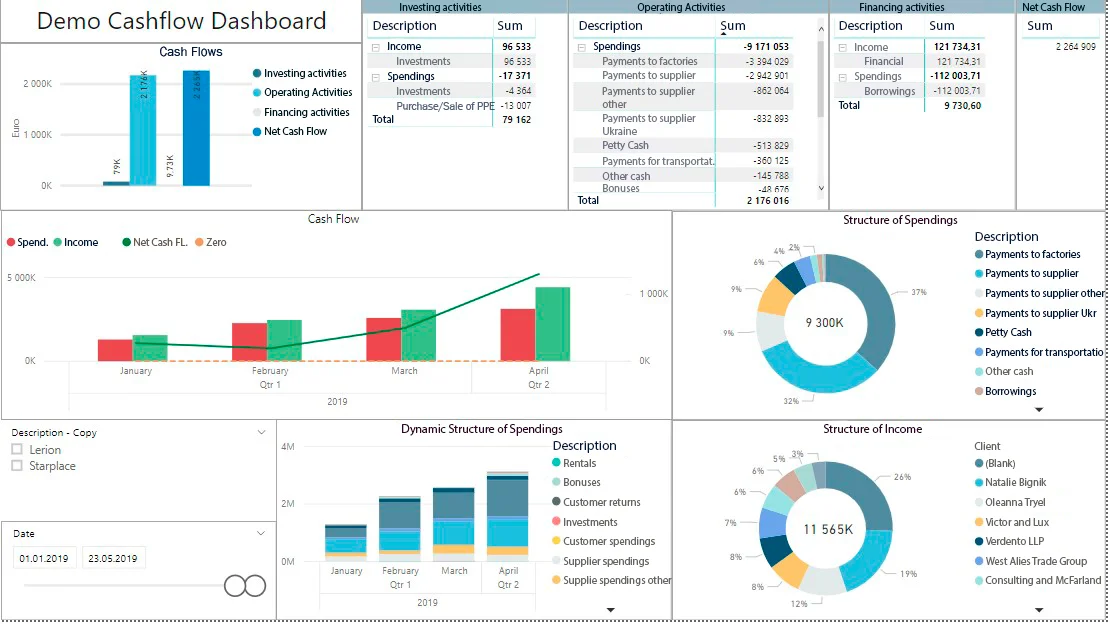
Financial Dashboard will guide you to your financial goalsPower BI financial dashboards will quickly show efficiency improvements, places to cut costs, fraud, and areas for income increases. Empower ...
Read More
25 Dec 2023
Retail Dashboard. Raise sales and audit the current business situationRetail dashboards will quickly show efficiency improvements, places to cut costs, lead to increased profit and to business growth🛒 Get our B ...
Read More
29 Nov 2023
Business Intelligence for ManufacturingUsing the Power BI tools cutting-edge services, companies can unlock the full potential of their manufacturing operations and embrace the fu ...
Read More457
dashboards created in 2024150+
years of IT experience among employees20
data experts & BI consultants12B
USD annual revenue of clients that utilize our analytics solutions