Financial Dashboard: допоможе вам досягти ваших фінансових цілей

Financial Dashboard: допоможе вам досягти ваших фінансових цілей

Power BI financial dashboards will quickly show efficiency improvements, places to cut costs, fraud, and areas for income increases. Empower your business!


Nowadays business companies have a sea of data, metrics, vital indexes and strive to put them together for an understandable picture.  Power BI financial dashboard is the key for such cases. To get a plethora of data the interactive dashboard collects all the information and visualizations to your daily updated report.

Financial dashboard will guide you to your financial goals showing the state of your business and financial health.

What is a Finance Dashboard?

It is a visualization tool that makes it easier to identify trends and spot potential issues. Power BI’s advanced data analytics helps our clients look for efficiency improvements, places to cut costs, fraud, and areas for increases in income.

The P&L report is connected with the calculation of sales, gross profit, financial incomes, and expenses to get the net profit.

The main metrics here are revenues from sales, cost of goods sold, gross profit and expenses of the company connected with operational (administrative salaries, rents, etc.) and non-operational activity, financial and other incomes, and costs to calculate net profit. Net profit is the result of P&L.
Cost of sales is not always shown by products, because there are general manufacturing expenses too. Moreover, manufacturing companies can use different principles to define Cost.
The Cashflow report clearly illustrates the situation why the company finishes the year with a profit but with no money in its accounts.

Factorial Analysis

It shows how the sales in units, the price, the discounts, the dollar exchange rate, the production cost, the expenditures on marketing, distribution, logistics, and other factors influence the aggregate financial result.

It enables the company to:

The main metrics in financial dashboards may include:

What does the Financial reporting dashboard show and what is it for?

In general it provides a chance to control the revenue, cost price, margin, the gross profit and other financial performance metrics and KPIs. There are three financial dashboard examples: P&L dashboard, Cashflow dashboard and Factorial Analysis to full-featured report consolidation for a group of companies.


All the mentioned above interactive reports give you vital KPIs any time updated and consolidated into a one screen reflecting your company’s financial state.

It gives you a concise view of result based reports which can reflect metrics by dates, in the regions, branches, KPIs, sales growth, and so on.

Main breakdowns could be:

General types of analyses are not just the fact, but also comparison of fact and last year, fact and plan, fact and last month, fact and deviations.

See more digital marketing dashboard examples to suit your needs and identify spend on and top/bottom performing products across each marketing funnel.


What are the target roles and dashboard users?

Clutch Review:

Number of Reviews

16

Project Cost Range

$

10.000

to

49.000

Average Referral Rating

5/

5

What does the Financial reporting dashboard show and what is it for?

Generally, all the key persons of the company need to track and provide financial control of business workflow. 

Financial dashboards  target roles and users positions in the organization are:

Cobit Solutions has an instrument that allows for identifying unobvious problems. This is often sufficient to save a business and provide it with an impulse for further development” – says Dmytro Chashnyk, CEO of Cobit Solutions, an Expert in IT with 19 years of experience, 10 years in CIO/CTO positions.

Other types of Financial dashboard:

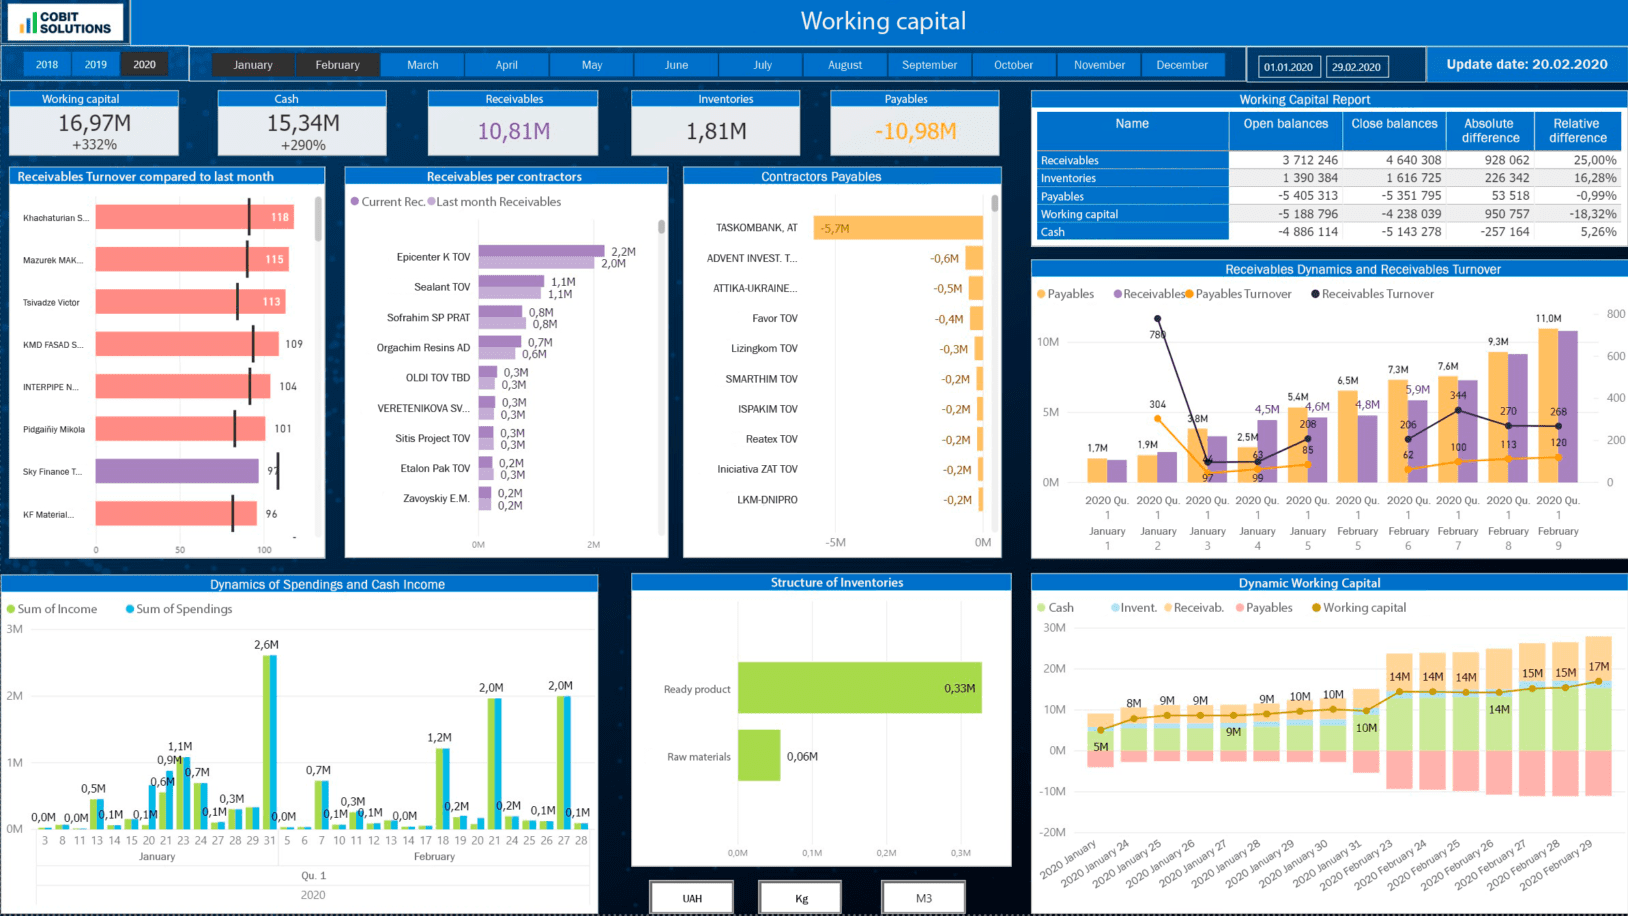
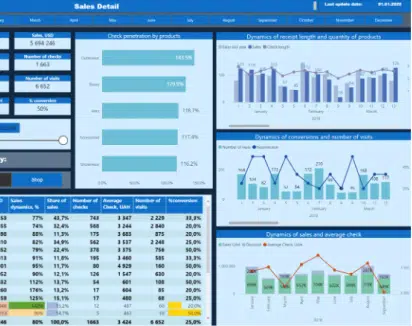
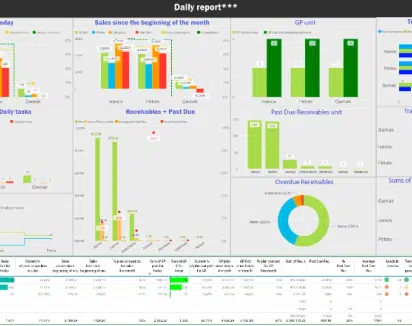
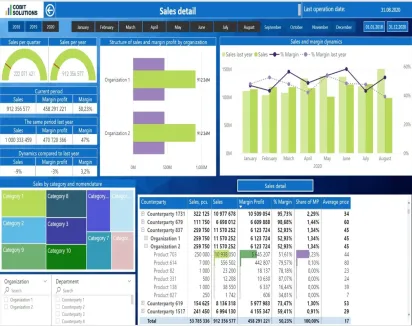
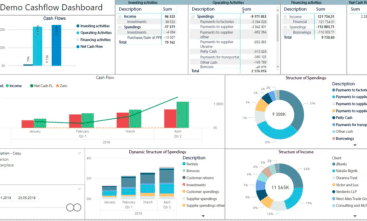
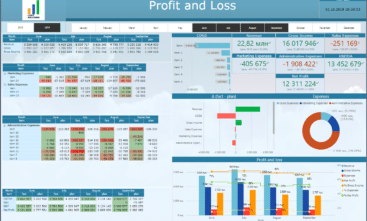
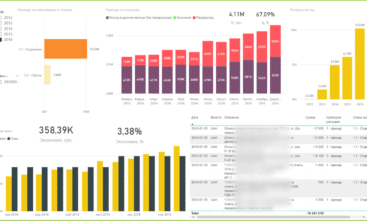
Financial DASHBOARD VARIATIONS

Our Power BI consultants will develop tailor made dashboards that will help effectively control sales

Cashflow

Cashflow

Рух грошових коштів

Profit & Loss (P&L)

Profit & Loss (P&L)

Звіт про прибутки та збитки компанії

Opex

Opex

Аналіз операційних витрат

OUR Power BI consultancy benefits

  • Leveraging best practices:
  • Saving your time and money
  • Power BI and data technology experts  implementing turn-key data solutions
  • Delivering customized dashboards crafted for your organization's needs
  • 20-30% less expensive than hiring a local FTE.


Cobit Solutions

Power BI, ETL, DWH Development:

[:uk-ua]stars.gif[:]
Quality
5.0/5
Schedule
5.0/5
Cost
5.0/5
Willing to Reffer
5.0/5

Turn-key BI implementation services:

ETL Data
Integration

[:uk-ua]file_code[:]

Get the turnkey ETL data integration services for ERP, API, CRM, DB, Excel and any other IPs.

BI Dashboard
Development

[:uk-ua]note_search[:]

Build custom dashboards tailored to business needs, including front-end interfaces and core back-end technologies.

Platform and
Infrastructure

[:uk-ua]processor[:]

Transforming your data silos into high-end decision-making tools on the Power BI platform for daily updated reports.

AI/ML and
Data Science

[:uk-ua]select_multiple[:]

Implementing AI/ML and data science options into interactive analytics solutions that help organizations increase revenue and margins.

What's Your Stack?

Our development services already power over 150 active engagements. We typically land our teams within 2 weeks, so you can start shipping top-quality software, fast.

ОТРИМАЙТЕ УПРАВЛІНСЬКИЙ ДАШБОРД КОРПОРАЦІЇ

Cobit Solutions

More articles and cases

Навіщо мені та моїй компанії інтерактивна звітність?

21 Січ 2022

Навіщо мені та моїй компанії інтерактивна звітність?

Часто звертаються клієнти, котрі вже чули про BI-систему, зацікавилися, але до кінця не знають про переваги. Скажу більше: буває, що на поча ...

Read More
Дебіторка: навіщо тримати “руку на пульсі”

27 Жов 2021

Дебіторка: навіщо тримати “руку на пульсі”

Відвантажуєте продукцію із відстроченням платежу? Продаєте до “Епіцентру” чи інших великих мереж? Чи не впевнені, що вони заплатили за все? ...

Read More

04 Січ 2024

Дешборд відділу продажів: дотримуйтеся своїх стратегічних цілей

Дешборд відділу продажів візуалізує метрики продажів, детальну інформацію про клієнтів, показники роботи команди для мотивації та винагороди ...

Read More

457

дашбордів зробили в 2022 році

86+

років досвіду в IT у співробітників

15

співробітників у компанії

215

тис.дол. заощадив наш клієнт через місяць роботи BI