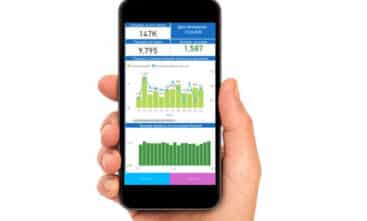
- Power BI економить фінансовому директору та його команді години роботи.
- Консолідує дані з розділених систем і мінімізує помилки, пов'язані з додаванням чисел вручну.
- Деталізує кожен показник аж до його первинної документації.
- Може виявити проблему ще до її загострення.
- Налагоджує комунікацію з генеральним директором і власником у зрозумілих для них термінах.
- Підвищує їхній статус у компанії та допомагає їм приймати стратегічні рішення.
Переваги бізнес-аналітики та дашборду фінансового директора
Оптимізує робочий час
Для аналітиків та фінансових фахівців рутинний збір даних та узагальнення звітів займають більшу частину їхнього робочого дня. Досить часто до цього процесу долучається і фінансовий директор. Це нудно, забирає багато часу та неефективно.
Система бізнес-аналітики допомагає автоматизувати звітність: налаштувати алгоритм обробки даних, а потім використовувати його безперервно в режимі автоматичного оновлення.
СПРОЩУЄ КОМУНІКАЦІЮ
Досвідчений фінансовий експерт може досить легко «читати» звітні таблиці, а іноді навіть бачить помилки без перерахунку даних. Труднощі починаються, коли потрібно «захищати» цифри на дошці перед генеральним директором та власником. Вони не завжди готові розбиратися в страхітливо виглядаючих таблицях з величезними обсягами даних.
Дані на панелі інструментів фінансового директора є наочними та зрозумілими навіть для людини, яка не є фінансовим спеціалістом. Окрім графіків та діаграм, ви також можете відображати візуальні підказки, на які висновки слід звернути увагу.
МАКСИМАЛЬНО ДЕТАЛІЗУЄ
Незважаючи на всю складність і тривалість процесу звітності, дані, які ми отримуємо в Excel, можуть бути лише другого рівня деталізації. Щоб глибше вивчити будь-який з показників, потрібно завантажити дані та знову узагальнити звіт. Це нескінченно складний і рутинний процес.
На панелі інструментів фінансового директора ви можете «переглянути» транзакції, банківську виписку або будь-який первинний документ. Інструмент дозволяє «бачити» та аналізувати дані для всіх систем одночасно.
ПОКАЗУЄ, ДЕ Є ПРОБЛЕМА
В Excel та в бухгалтерських системах потрібно докласти чимало зусиль, щоб знайти необхідні показники, а особливо порівняти різні періоди. Розібратися в довжелезних таблицях непросто, і вони не є наочними для вищого керівництва компанії чи власника бізнесу.
У бізнесі кожна затримка у прийнятті рішень та виявленні недоліків у роботі коштує чималих грошей.
Інтерактивна звітність — це графіки та діаграми, які дозволяють одразу побачити, де саме знаходиться проблема.
POWER BI ДЛЯ ФІНАНСОВОГО ДИРЕКТОРА КОНСОЛІДУЄ ДАНІ ТА МІНІМІЗУЄ ПОМИЛКИ
Керівники великого бізнесу не можуть отримати повного уявлення про ситуацію через велику кількість ІТ-систем та погану інтеграцію між ними. ERP, CRM-системи, Excel, OLAP-куби та інші дозволяють накопичувати величезні масиви даних, але не дають змоги аналізувати їх та перетворювати на інструмент для прийняття рішень. Система бізнес-аналітики робить це можливим.
- Вас також може зацікавити стаття власника Cobit Solution Дебіторка: навіщо тримати “руку на пульсі”
- Детальніше про реальні випадки впровадження BI-систем у різних галузях читайте у нашому БЛОЗІ
- Рішення для бізнес-аналітики: 12 найкращих прикладів інформаційних панелей та звітів Power BI у 2026 році
Якщо ви фінансовий директор, зв'яжіться з нами
Cobit Solutions автоматизує та консолідує звіти,
що допоможе вашим аналітикам звільнити час
та спрямувати свої ресурси на стратегічні питання та прогнозування.


