BI у логістиці: як знайти посилку?

BI у логістиці: як знайти посилку?

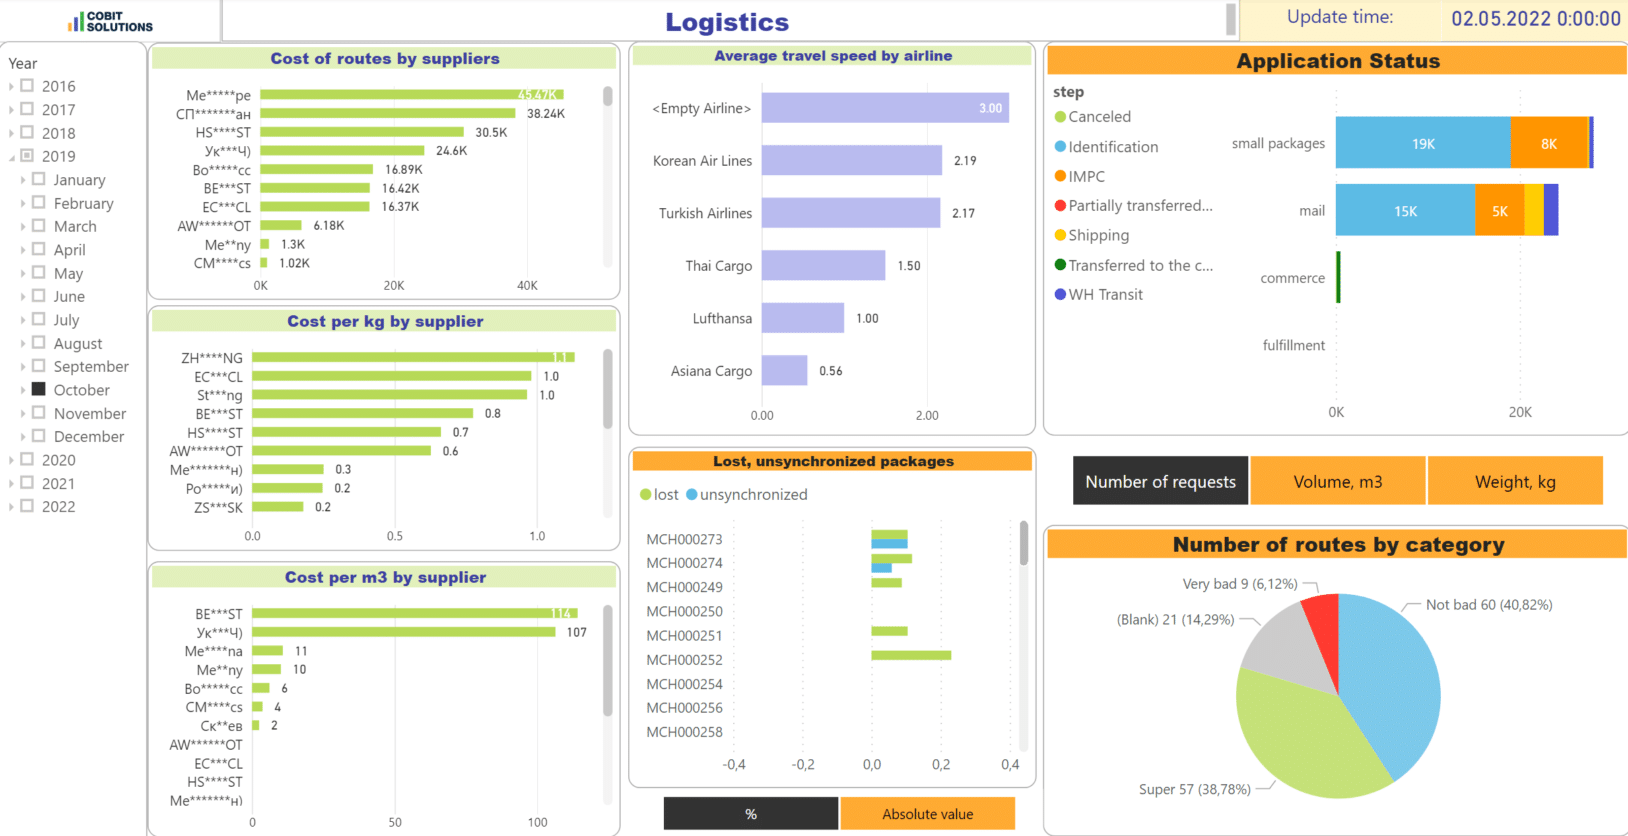
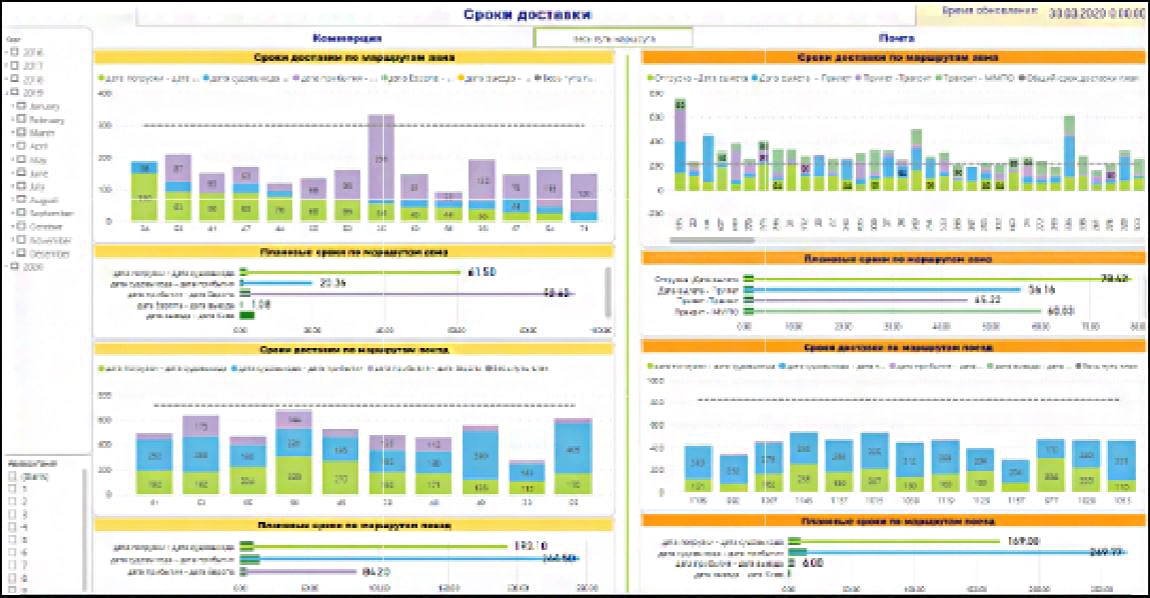
Один із клієнтів має десятки тисяч посилок на місяць. Частина їх регулярно зависає. Відстежити вручну якому етапі відбувається збій майже неможливо. Звичайно, це викликає негатив у кінцевого споживача, і призводить до збитків компанії.

One of the clients receives tens of thousands of parcels per month as shows logistics intelligence. Some of them get stuck regularly. It is practically impossible to manually detect the stage that the failure takes place at.

Each parcel travels a long way, which includes customs clearance:

  1. Delivery from the supplier to the Distribution Center in the country of manufacture
  2. Delivery to Ukraine and customs clearance
  3. Delivery to the Distribution Center in Ukraine
  4. Delivery to the client


This is the general framework for logistics management, but there are very many nuances inside it. A great deal of goods arrives with delays. Naturally, this causes negative emotions in the end-use customer, and results in losses for the company.

BUT HOW DO WE IDENTIFY THE PROBLEM?

All the information on logistics management is recorded in different ERP reports. To find the cause, one would have to “sift through” them for every stage, every supplier, and every parcel. 

In addition to time consumption, in actual fact, the problem may as well be overlooked, as was the case previously for a number of orders.

How did we at COBIT SOLUTIONS help the client identify the problem and simplify the logistics management?

1 000 000
losses while a company looks for a problem for months

Now the client can control the following aspects online on logistics intelligence dashboards: 

  • Whether there are any delays and disruptions in the supplies right now; 
  • What stage the disruption takes place at logistics intelligence; 
  • Which mode of transport causes disruptions more often; 
  • Which supplier has caused the problem now and causes disruptions regularly; 
  • How much loss can be caused by late delivery with reference to a particular route and supplier.

Based on interactive logistics intelligence reporting, the company can make a conclusion as to whether they should stop using the supplier’s services, or maybe change the route, and so on. Our task is to let them see the vulnerabilities.

BUT THE MAIN POINT OF THE ANALYTICS IS
PROFIT GROWTH

Our dashboards give you a chance to control the revenue, cost price, margin, gross profiе and 47 other indicators on a daily basis. No need to wait for a monthly report.

Consistent control results in  profit growth and business expansion.

ОТРИМАЙТЕ УПРАВЛІНСЬКИЙ ДАШБОРД КОРПОРАЦІЇ

Cobit Solutions

More articles and cases

ERP vs BI: 5 фундаментальних відмінностей

22 Січ 2022

ERP vs BI: 5 фундаментальних відмінностей

Чи є сенс встановлювати BI-систему та платити чималі гроші? Адже наші фінансисти та бухгалтери непогано справляються з урахуванням 1С? Питан ...

Read More
BI в енергетиці: що контролюватиме щодня?

21 Січ 2022

BI в енергетиці: що контролюватиме щодня?

Тема оперативного відстеження ринку та актуальності своєї пропозиції ціни виявилася дуже актуальною для ринку енергетики. Незважаючи на гіга ...

Read More
Чернетка

09 Чер 2022

Чернетка

457

дашбордів зробили в 2022 році

86+

років досвіду в IT у співробітників

15

співробітників у компанії

215

тис.дол. заощадив наш клієнт через місяць роботи BI