
ЕТАП 1
«ПРОЄКТУВАННЯ АРХІТЕКТУРИ BI»
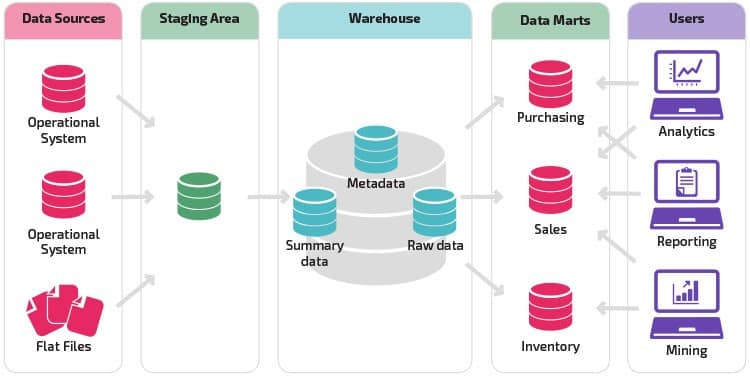
- Дослідження даних, що існують у ваших ІТ-системах.
- Складання списку індикаторів та інформаційних панелей.
- Схематичне зображення основних інформаційних панелей та структури ІТ.
- Підготовка плану проєкту впровадження системи бізнес-аналітики та кошторису.
Дізнайтеся більше про реальні випадки впровадження системи бізнес-аналітики в різних галузях у нашому БЛОЗІ
Термін: 4 тижні
ЕТАП 2
«ІМПОРТУВАННЯ ДАНИХ З ІТ-СИСТЕМ»
- Налаштування ваших систем.
- Створення структури сховища в BI.
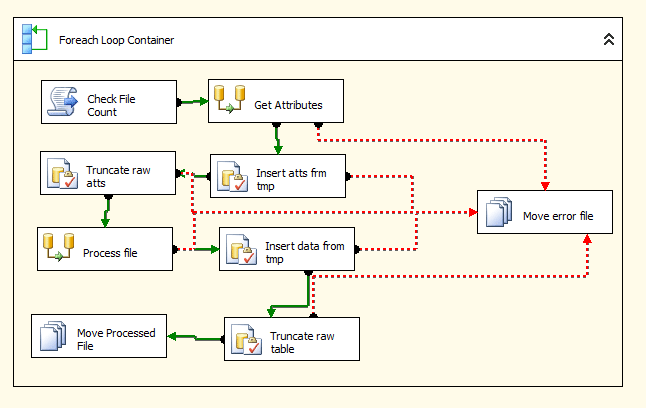
- Розроблення модулів для імпорту даних до BI для ваших джерел даних.
- Імпортування даних з різних джерел.
- Формалізація існуючої облікової політики у вигляді алгоритмів.
- Налаштування автоматичного оновлення даних.
- Налаштування продуктивного сервера для системи аналітики.
- Підготовка панелей звірки.
- Виконання звірки даних разом із вашими співробітниками.
- Внесення необхідних коректив у модулі синхронізації даних.
Дізнайтеся більше про переваги Power BI: Навіщо BI-система фінансовому директору?
Термін виконання: 1-2 місяці


ЕТАП 3
«ВІЗУАЛІЗАЦІЯ ДАНИХ ТА ІНФОРМАЦІЙНІ ПАНЕЛІ»
- Обговорення детальної логіки розрахунку показників та метрик.
- Впровадження зазначених алгоритмів розрахунку.
- Розробка візуалізації.
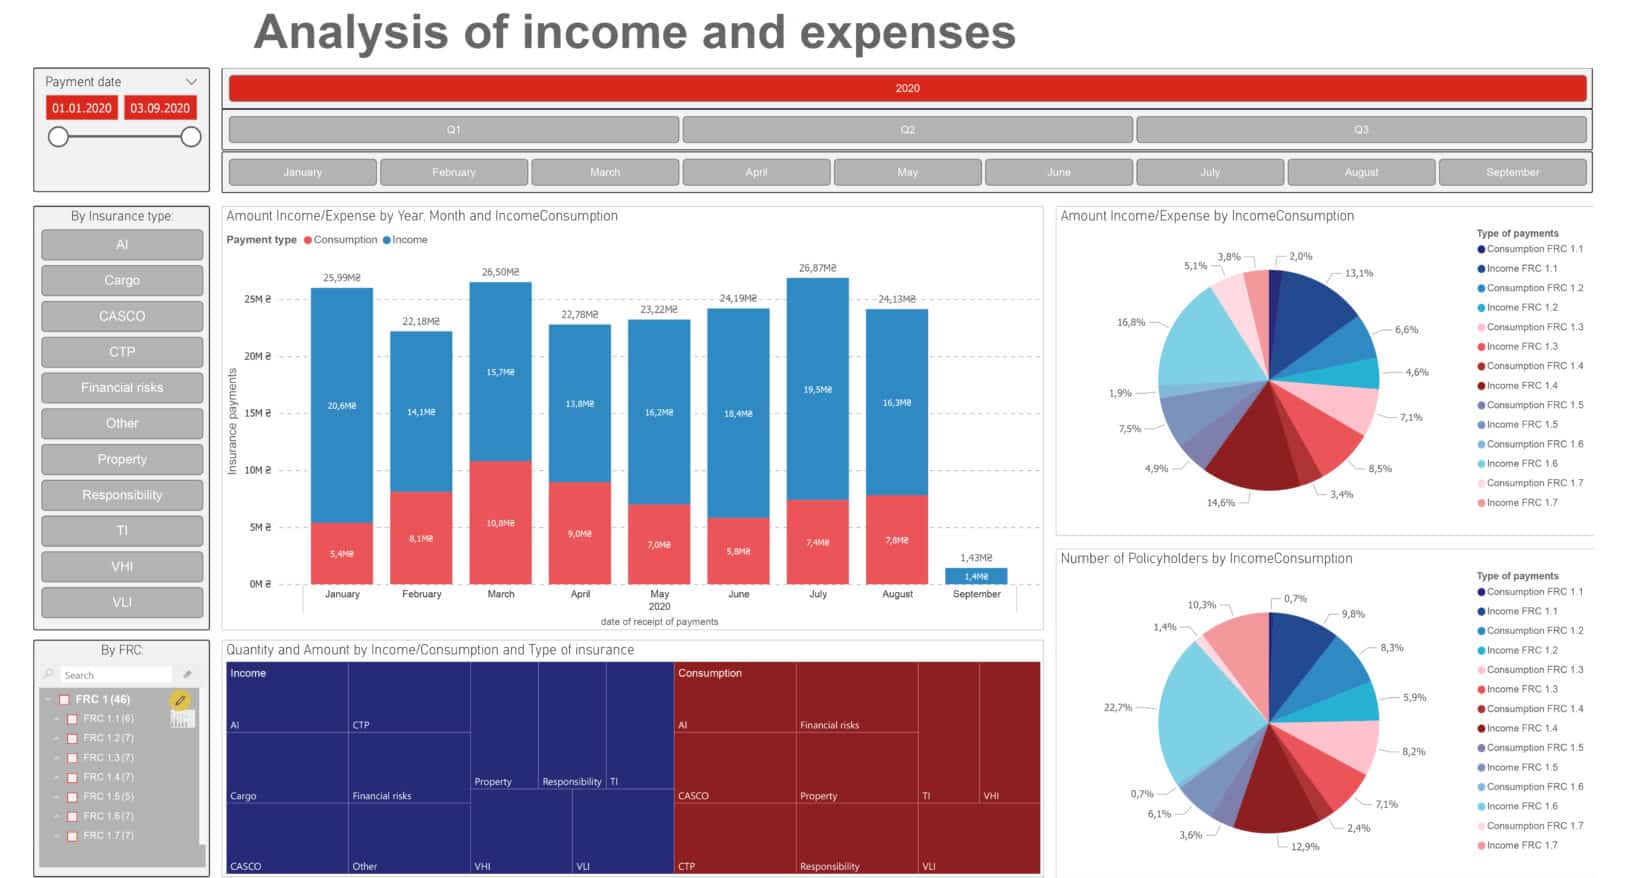
- Впровадження макета інформаційної панелі: 20 %, які ви можете бачити.
- Налаштування інтерактивних елементів інформаційної панелі.
- Завершення перевірок, демонстрація всього цього клієнту та внесення коректив.
- Навчання персоналу клієнта користування інформаційною панеллю та отримання економічних вигід.
Термін: 1-2 місяці
ЕТАП 4
«ОБСЛУГОВУВАННЯ ТА ІНШІ ВАШІ ПОБАЖАННЯ, ЯКІ МОЖУТЬ ВИНИКНУТИ ПІСЛЯ ВПРОВАДЖЕННЯ BI»
- Редагування кольорів та візуальних елементів.
- Додавання фільтрів та спливаючих інструкцій.
- Налаштування додаткових доступів.
- Надання відповідей на будь-які запитання, що виникають у процесі впровадження Power BI.
Пакети підтримки від 10 годин на місяць
АЛЕ ГОЛОВНА СУТЬ АНАЛІТИКИ — ЦЕ ЗРОСТАННЯ ПРИБУТКУ
Наші інформаційні панелі дають вам можливість щодня контролювати дохід, собівартість, маржу, валовий прибуток та 47 інших показників. Не потрібно чекати щомісячного звіту.
Постійний контроль призводить до зростання прибутку та розширення бізнесу.


