BI-система: Як відбувається процес впровадження?

BI-система: Як відбувається процес впровадження?

Скільки потрібно часу на розробку? Як відбувається процес? Які етапи впровадження BI системи?

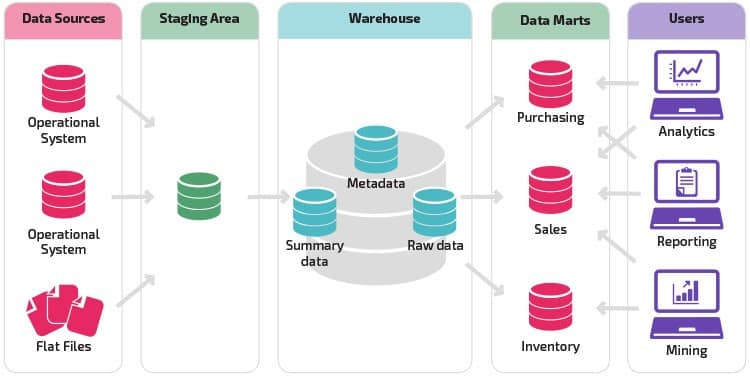
Насамперед варто розуміти, що гарні візуалізації становлять 20% від обсягу робіт. Це є вершина айсберга.

Розбираємося з процесом перетворення таблиць в Excel до зрозумілих та красивих дашбордів з даними про ваш бізнес чи підрозділ.

STAGE 1
'DESIGNING THE BI ARCHITECTURE'

  1. Explore the data existing in your IT systems
  2. Make a list of the indicators and dashboards 
  3. Sketch the main dashboards and IT structure
  4. Prepare the plan for the BI implementation system project and the cost estimate.
    Read more on real cases of BI system implementation in different industries on our BLOG

Time frame: 4 weeks

STAGE 2
'IMPORTING THE DATA FROM IT SYSTEMS'

  1. Set up your systems 
  2. Create the storage structure in BI 
  3. Develop the modules for data import to BI for your data sources 
  4. Import data from different sources
  5. Formalize the existing accounting policy in the form of algorithms 
  6. Set up automatic data updates
  7. Configure a productive server for the analytics system 
  8. Prepare reconciliation dashboards 
  9. Perform data reconciliation together with your staff 
  10. Make the necessary adjustments of the data synchronization modules.

Read more about the Power BI advantages: WHY DOES MY COMPANY NEED BUSINESS INTELLIGENCE?

Time frame: 1-2 months

STAGE 3
'DATA VISUALIZATION AND DASHBOARDS'

  1. Discuss the detailed logic of indicator and metric calculation 
  2. Implement the specified calculation algorithms 
  3. Design the visualizations
  4. Implement the dashboard layout: the 20% that you can see 
  5. Configure the dashboards’ interactive elements 
  6. Complete the checks, demonstrate it all to the client, and make the adjustments 
  7. Teach the client’s personnel to use the dashboards and derive the economic benefits.

Time frame: 1-2 months

STAGE 4
'MAINTENANCE AND ANY OTHER WISHES YOU MAY HAVE AFTER THE BI IMPLEMENTATION'

  1. Edit the colors and the visual elements 
  2. Add filters and pop-up instructions
  3. Set up extra accesses
  4. Answer any questions that arise in the process of Power BI implementation.

Support packages starting at 10 hours per month

BUT THE MAIN POINT OF THE ANALYTICS IS
PROFIT GROWTH

Our dashboards give you a chance to control the revenue, cost price, margin, gross profiе and 47 other indicators on a daily basis. No need to wait for a monthly report.

Consistent control results in  profit growth and business expansion.

ОТРИМАЙТЕ УПРАВЛІНСЬКИЙ ДАШБОРД КОРПОРАЦІЇ

Cobit Solutions

More articles and cases

Кейс. Чому не можна орієнтуватися на валовий дохід?

22 Січ 2022

Кейс. Чому не можна орієнтуватися на валовий дохід?

Прибуток підприємства не пропорційна доходу. Очевидно? Не факт. Ділюсь історією з робочої практики із замовником із сфери виробництва. ...

Read More
Чернетка

09 Чер 2022

Чернетка

457

дашбордів зробили в 2022 році

86+

років досвіду в IT у співробітників

15

співробітників у компанії

215

тис.дол. заощадив наш клієнт через місяць роботи BI