4 основних звіти для бізнесу в Power BI

4 основних звіти для бізнесу в Power BI

Метою будь-якого бізнесу зрештою є отримання прибутку. А під час кризи це ще й мінімізація касових розривів.

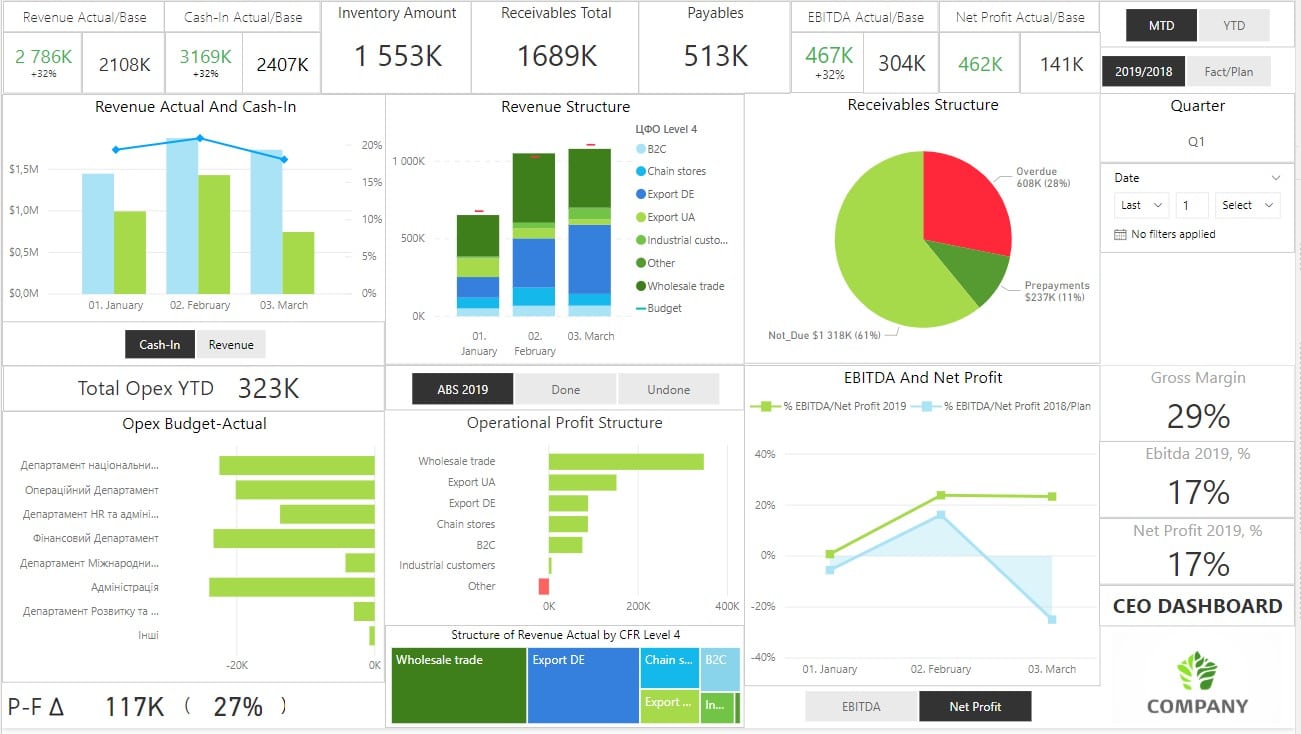
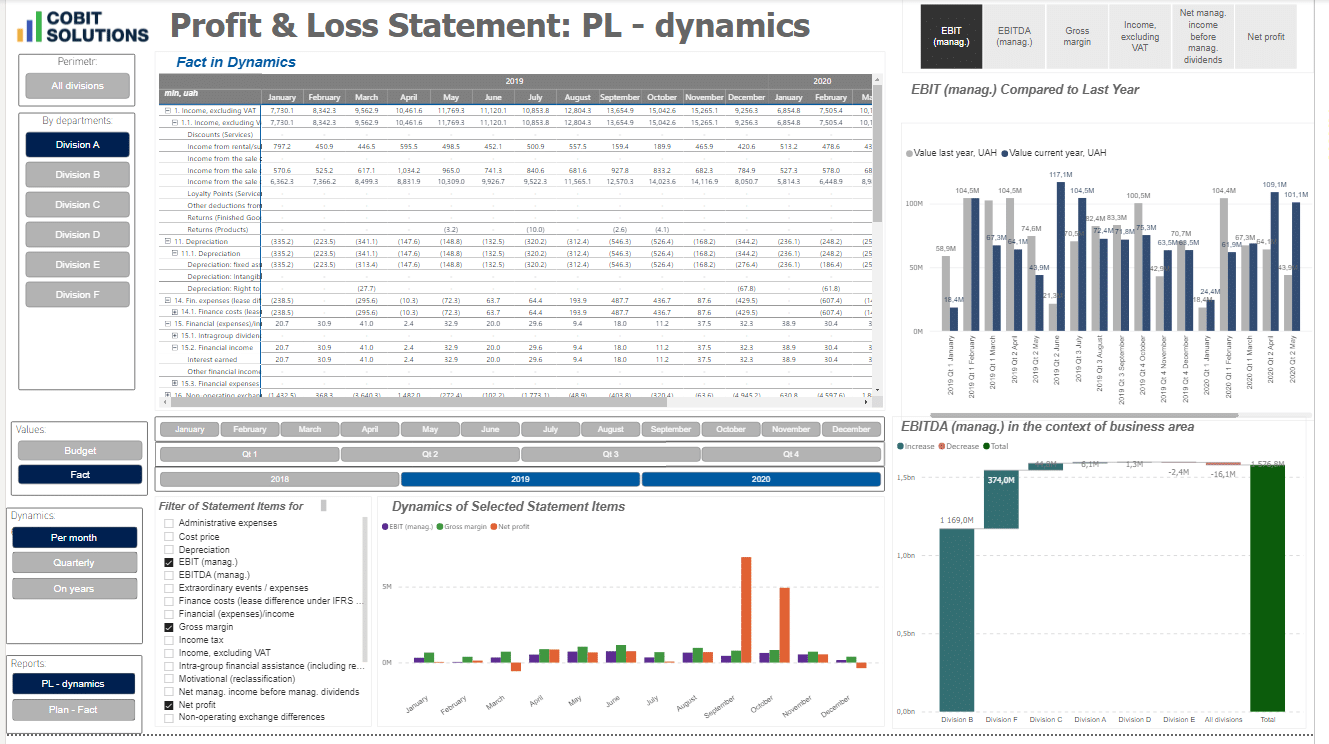
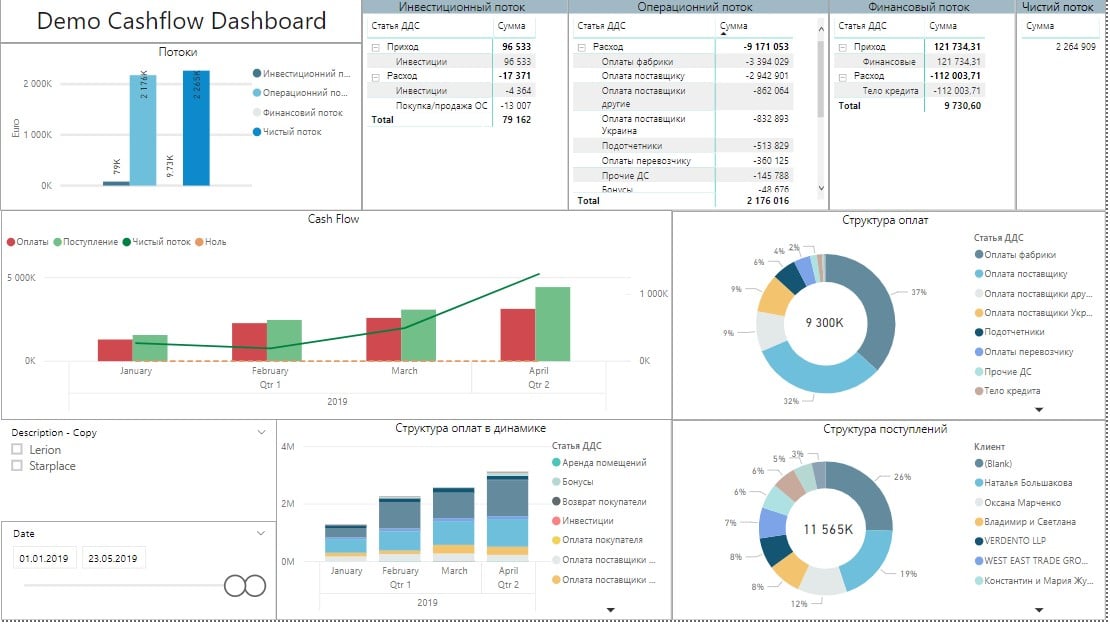
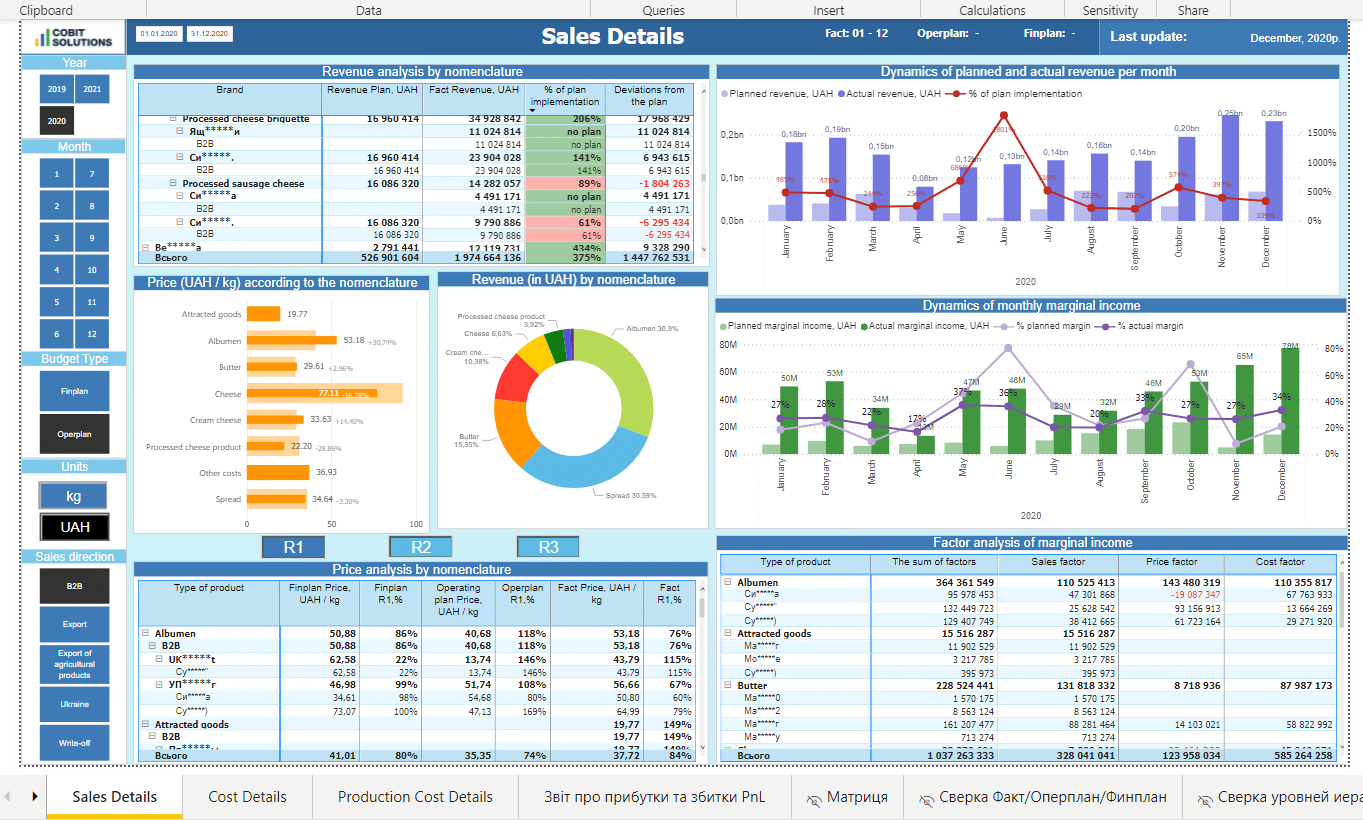
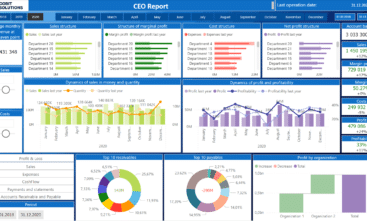
Покажу на прикладі 4 основних фінансових звітів, як працює інтерактивна звітність Power BI і які завдання вирішує.

1. KPI KEY PERFORMANCE INDICATORS

These are a company’s digitized goals for the year. The KPIs are often displayed in Excel or in the system of indicators (Balanced Scorecard). 

What are the benefits of KPIs in Power BI: 

  • They consolidate the cash receipts and the margin from ERP, the sales from CRM, the indicators from any other systems, and the plans from Excel into one dashboard; 
  • KPIs Power BI help control the achievement of the financial goals in real time; 
  • They show the comparison with the previous period and plan: Plan/Fact, YoY, Like4Like; 
  • Business intelligence KPIs allow for financial modeling and scenario forecasting with reference to the influence of factors.

You might find this interesting: WHY DOES MY COMPANY NEED BUSINESS INTELLIGENCE?

2. THE PROFIT AND LOSS: P&L POWER BI EXAMPLE REPORT

What are the benefits of P&L in Power BI: 

  • It demonstrates the growth or decline factors; 
  • It shows the cost reduction and profit increase points; 
  • It visualizes the diagrams of expenditure, marginal profit, revenue, and the dynamics for each of those broken down by day, month, and quarter; 
  • It helps control the actual or short-received profits on a day-to-day basis. 
  • It helps compare the indicators with the previous periods or budgets; 
  • It details every indicator, for example, to the counterparty and the particular accounts receivable period; 

Read more on real cases of BI system implementation in different industries on our: BLOG  

3. CASHFLOW: THE MOVEMENT OF FUNDS POWER BI EXAMPLE REPORT

What are the benefits of CashFlow in Power BI: 

  • It clearly illustrates the situation why the company finishes the year with a profit but with no money in its accounts; 
  • It shows the actual amount of money in the accounts
  • It divides the cash flow into the operational and investment flows
  • It offers the opportunity to fall through to every bank statement; 
  • It merges several report sources (ERP, OLAP cubes, Terrasoft) and displays the balance for all of them on one dashboard;

4. FACTORIAL ANALYSIS OF INCOME AND MARGINAL PROFIT

The dashboard shows how the sales in units, the price, the discounts, the dollar exchange rate, the production cost, the expenditures on marketing, distribution, logistics, and other factors influence the aggregate financial result. 

It enables the company to: 

  • Get an understanding of the factors’ impact on the gross profit on a day-to-day basis.
  • Control the margin for different sales channels.
  • Keep track of the dynamics of sales and production cost.
  • Keep track of the dynamics of the factors.
  • Keep track of the marginality of a particular transaction, goods or service.

HOW BI INCREASES THE PROFIT

Opting for Power BI allows you to control the income, production cost, margin, and gross profit every day, without having to wait for the monthly “summarization” of reporting. 

Eventually, regular control results in an increase in profit and growth of your business. 

 If you are interested in the possibility of configuring interactive reporting, please contact us. 

ОТРИМАЙТЕ УПРАВЛІНСЬКИЙ ДАШБОРД КОРПОРАЦІЇ

Cobit Solutions

More articles and cases

25 Гру 2023

Роздрібний дешборд. Збільшуйте продажі та перевіряйте поточну бізнес-ситуацію

Роздрібні інформаційні панелі швидко покажуть покращення ефективності, місця для скорочення витрат, що призведе до зростання прибутку та біз ...

Read More

23 Гру 2023

Financial Dashboard: допоможе вам досягти ваших фінансових цілей

Power BI financial dashboards will quickly show efficiency improvements, places to cut costs, fraud, and areas for income increases. Empower ...

Read More

03 Січ 2024

Маркетинговий дешборд. Оцініть діяльність і кампанії

Отримайте професійні маркетингові дешборди з досвідченими фахівцями Cobit Solutions, які впровадили Power BI в десятках галузей. Розвивайте ...

Read More

457

дашбордів зробили в 2022 році

86+

років досвіду в IT у співробітників

15

співробітників у компанії

215

тис.дол. заощадив наш клієнт через місяць роботи BI