СИСТЕМА ОБЛІКУ ПРОТИ КОНСОЛІДАЦІЇ ДАНИХ
ERP — це, перш за все, система бухгалтерського обліку. Вона стосується бухгалтерського та податкового обліку, складського, управлінського та касового обліку. Будь-яких видів обліку. Усі звіти формуються виключно на основі даних, що містяться в самій системі ERP.
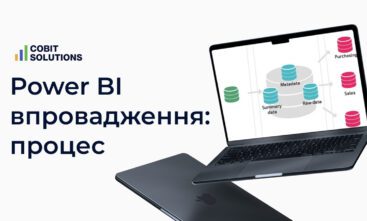
Power BI — це онлайн-сервіс, призначений для консолідації даних з усіх бухгалтерських систем на одній платформі, що включає 2 різні ERP-системи.
З яких систем ми найчастіше консолідуємо дані на запит клієнтів? Excel, ERP, SAP, CRM-систем та будь-яких інших. Ми також автоматизуємо збір даних з веб-сайтів.
ТАБЛИЧНИЙ ФОРМАТ ПРОТИ ВІЗУАЛЬНОГО
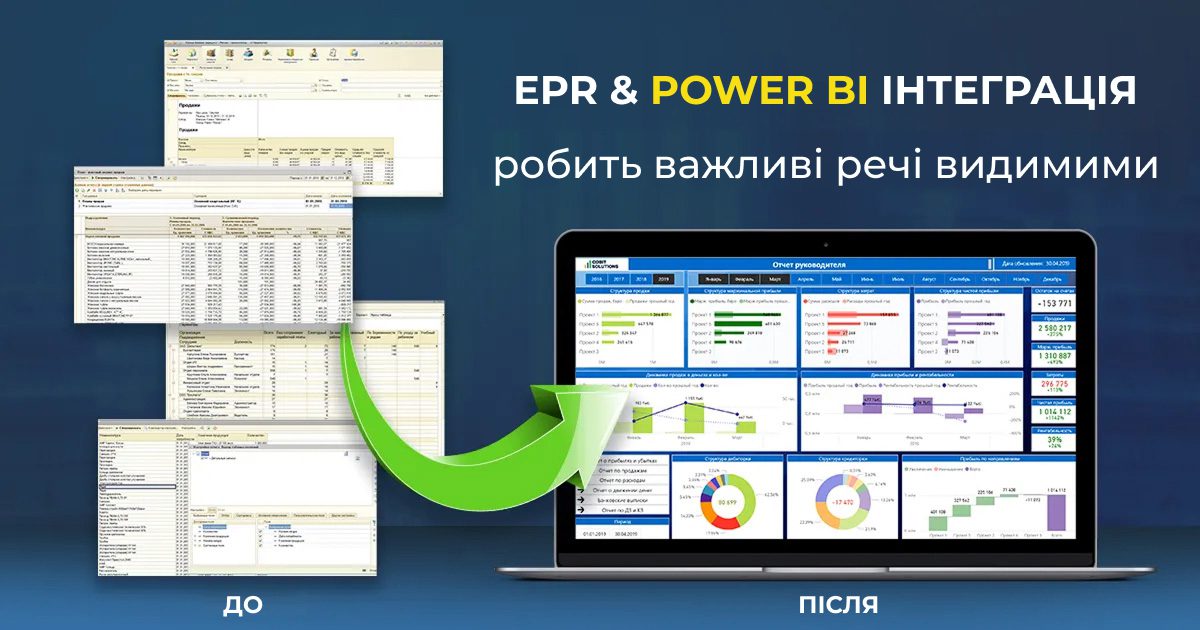
Для більшості неспеціалістів та власників бізнесу ERP — це лише набір цифр у стовпцях таблиці. Отже, дані не є наочними. На їх основі важко приймати управлінські рішення.
Power BI сприяє прийняттю математично обґрунтованих рішень. Дані про бізнес чітко видні.
Інтерактивні інформаційні панелі дозволяють виділити фактори, що впливають на зміну показників. Водночас вони дають змогу побачити негативну тенденцію та прийняти рішення на етапі, коли проблема тільки виникає.
Згідно з опитуванням Qlik, саме це підвищує інтерес підприємців до Power BI.
СТАТИЧНЕ ПРОТИ ІНТЕРАКТИВНОГО
ERP відображає статичні дані у вигляді багатосторінкових нерозбірливих звітів. Кожен новий розділ звіту доводиться фільтрувати та завантажувати окремо, що займає час співробітників і керівників.
BI-система дозволяє в режимі онлайн фільтрувати та аналізувати всі бізнес-показники в динаміці: прибуток, продажі, бренди, проекти, окремі SKU, проблемні області.
Що можна контролювати в Інтернеті, наприклад, у сфері продажів та роздрібної торгівлі?
- які магазини мають найбільший обсяг продажів;
- найбільш маржинальні товари, бренди;
- динаміку для кожного товару, відділу, магазину, продавця;
- чи виконано план продажів і на скільки відсотків;
- відображення найкращих менеджерів з продажу за певний період.
СТАЦІОНАРНИЙ ДОСТУП ПРОТИ СВОБОДИ
Щоб користуватися ERP, необхідно придбати ліцензію та встановити спеціалізовані програми. Або ж можна переглядати величезні звіти в Excel, підготовлені аналітиками. Про мобільність та наочність таких звітів не може бути й мови.
Для використання BI-системи не потрібно встановлювати додаткові програми. Інтерактивні звіти можна переглядати з будь-якої точки світу, з хмари, з будь-якого типу пристрою, навіть зі смартфона. Все, що потрібно, — це доступ до Інтернету.
Власник бізнесу не повинен встановлювати ERP, але може контролювати всі консолідовані дані одночасно в системі BI. Таким чином, управлінський облік і робота всього фінансового відділу можуть контролюватися на візуальних інформаційних панелях.
Дізнайтеся більше про інтеграцію 1С в Power BI: ІНТЕГРАЦІЯ 1С І POWER BI ЗА 3 ДНІ
ЗАВАНТАЖТЕ БЕЗКОШТОВНИЙ ЧЕКЛІСТ
із 25 рекомендацій для успішного впровадження бізнес-аналітики


РУЧНА ПРАЦЯ ПРОТИ АВТОМАТИЗАЦІЇ
Процес підготовки звітів в ERP виглядає приблизно так: дані вводяться, дані завантажуються, починається формування звіту в Excel, звіт надсилається керівнику. Але було використано неправильний аналітичний розділ, і процес починається заново. Зазвичай в компанії є 2+ фахівці, які відповідають за завантаження даних і формування звітів.
У системі BI ми налаштовуємо автоматизацію всіх даних. Дані в інтерактивних дашбордах оновлюються автоматично кожні 1-2 години. Власник і топ-менеджер можуть бачити актуальну інформацію, яка була введена в ERP і всі інші бухгалтерські системи, без необхідності залучення додаткових співробітників.
Що ще допомагає автоматизувати система BI?
- відстежувати всю схему бізнес-процесу та виявляти її вразливості, шукати можливості для покращення бізнес-процесу;
- налаштовувати автоматичні сповіщення про досягнення певних показників: ключових показників ефективності (KPI), зниження прибутку нижче норми тощо.
АЛЕ ГОЛОВНА СУТЬ АНАЛІТИКИ — ЦЕ ЗРОСТАННЯ ПРИБУТКУ
Наші інформаційні панелі дають вам можливість щодня контролювати дохід, собівартість, маржу, валовий прибуток та 47 інших показників. Не потрібно чекати щомісячного звіту.
Постійний контроль призводить до зростання прибутку та розширення бізнесу.